
Le Taux de Rendement Global (TRG) est un indicateur universel pour évaluer l'efficacité opérationnelle en fabrication. Bien qu'il existe beaucoup d'information sur la façon de calculer le TRG et sur sa définition, cet article met en lumière la manière dont Worximity mesure votre TRG dans sa solution de surveillance de production.
Le TRG et ses facteurs : identifier les sources de pertes
Le score TRG offre un instantané de votre état opérationnel, avec ses trois facteurs clés — Disponibilité, Performance et Qualité — qui jouent un rôle déterminant pour cibler les zones de pertes et orienter les efforts d'amélioration.
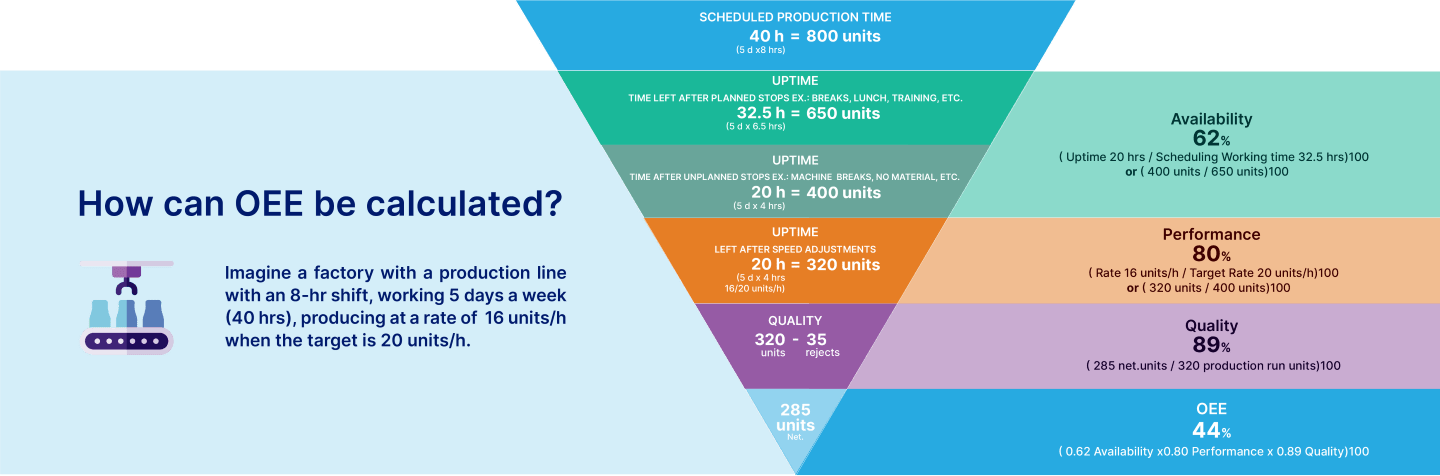
Imaginons une usine de fabrication avec une ligne de production qui a :
- un quart de 8 heures, 5 jours par semaine (40 heures/semaine), et
- une cadence cible de 20 unités/heure (800 unités/semaine).

Perte de disponibilité : temps d'arrêt non planifiés
Lorsqu'une machine ne fonctionne pas comme prévu en raison de temps d'arrêt non planifiés — pannes ou ruptures de matière —, il en résulte une perte de disponibilité et un temps de production réduit. Notons que les temps d'arrêt planifiés, comme les pauses et les repas, sont exclus du calcul du TRG et relèvent plutôt de l'efficacité opérationnelle globale (OOE).
Dans le scénario ci-dessus, si 7,5 heures de temps d'arrêt planifié sont prévues pour la semaine et que la ligne de production perd 12,5 heures supplémentaires en temps d'arrêt non planifié, elle produira 400 unités au lieu des 650 potentielles, soit une disponibilité de 62 %.

Perte de performance : inefficacités de cadence
La perte de performance survient lorsqu'une machine fonctionne sous sa vitesse maximale.
En reprenant notre exemple, si la ligne tourne à 16 unités par heure au lieu de 20, elle produira 320 unités sur les 400 attendues — soit une performance de 80 %.

Perte de qualité : non-conformité aux normes
La perte de qualité se produit lorsque les unités produites ne répondent pas aux normes requises, entraînant rejets et reprises. Dans notre scénario, 35 unités ont été rejetées lors du contrôle qualité, ce qui donne un score qualité de 89 %.

Résumé : quantifier les pertes en temps, en unités et en argent
Lorsqu'un des facteurs du TRG tombe sous 100 %, cela indique une perte quantifiable en temps, en unités et en argent. Dans l'exemple, il restait 285 unités nettes sur les 650 planifiées, ce qui illustre l'impact des temps d'arrêt non planifiés, des cadences sous-optimales et des problèmes de qualité.
En surveillant et en optimisant ces facteurs avec rigueur, vous pouvez réaliser des améliorations significatives à chaque étape de votre processus de production, ce qui se traduit par une efficacité accrue et des économies de coûts.
Repères TRG : fixer des objectifs réalistes
Seiichi Nakajima a introduit les concepts de TRG et de maintenance productive totale (TPM) dans les années 1970. Dans son ouvrage Introduction to TPM, il proposait quatre chiffres « de classe mondiale » : disponibilité de 90 %, efficacité de 95 % et qualité de 99 %, donnant un TRG de 85 %.
- 100 % de TRG est considéré comme une production parfaite
- 85 % de TRG reflète des opérations de classe mondiale
- 60 % de TRG est typique et moyen
- 40 % de TRG est faible mais pas rare
Des variations existent selon les industries, et les cibles peuvent différer selon la taille de l'entreprise, son type et les nuances de ses opérations.
Pour évaluer votre TRG, il est crucial de tenir compte des dynamiques réelles de vos opérations. Il existe des différences entre fabricants ayant un grand ou un petit éventail de produits, ce qui influence les cibles de disponibilité, d'efficacité et de qualité. Commencez par télécharger notre calculateur TRG gratuit.