

You are all set. You installed the TileBoard app and TileBoard Connect Smart Sensors on a couple of your factory production lines to test the experience. You want to see how the system works and how well you and your team work with the system. Everyone has received training and you’ve incorporated the technology into day-to-day operations. You’ve been observing the data collected by TileBoard in real-time and your team has been logging instances of downtime and it's going well. For this initial period, you want to monitor downtime and giveaway and how well the machines on each production line functions. So, what next?
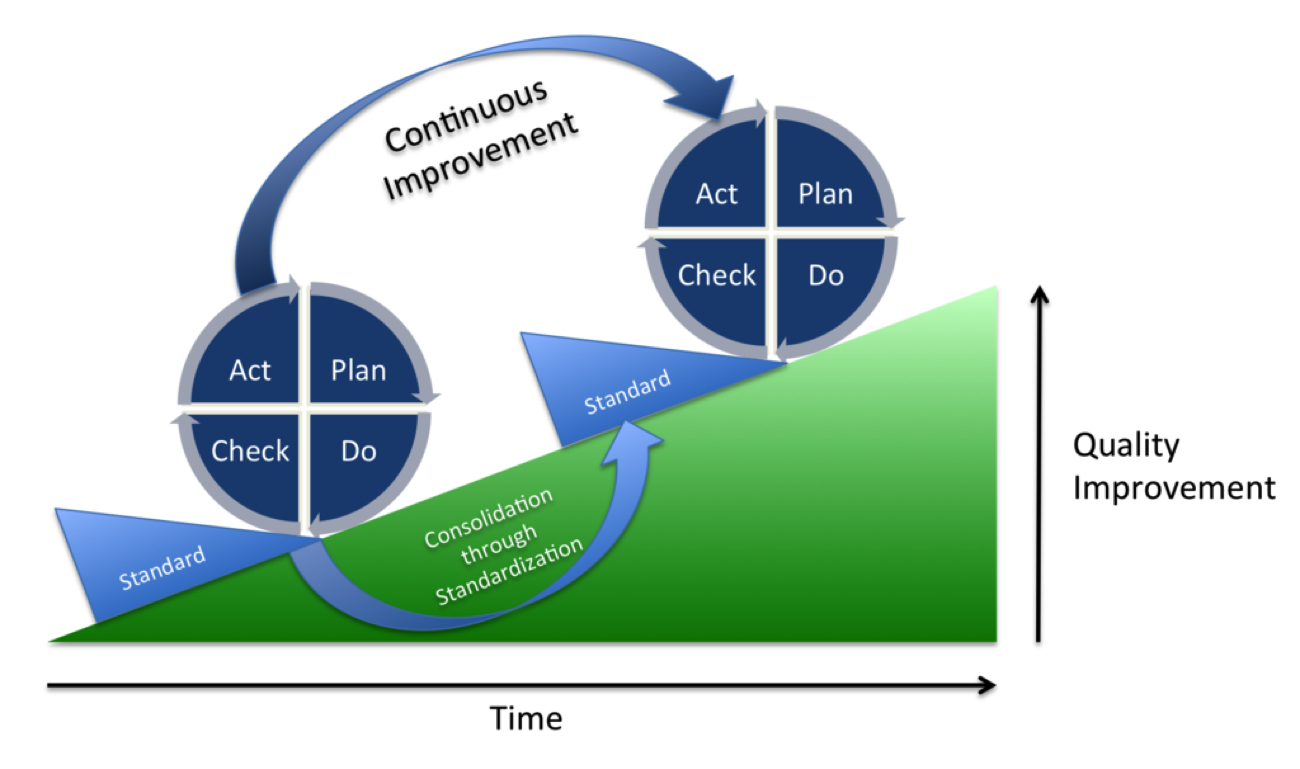
The TileBoard Digital Action or Continuous Improvement Plan is a four-step process for carrying out change and mirrors the PDCA Cycle—PLAN-DO-ACT-CHECK.
The steps are:
Plan – Pinpoint an area for focus, and create an action plan
Do – Carry out a small-scale test of the change’s effectiveness
Check – Analyze the results and identify actionable insights from the test
Act – If the test yielded positive outcomes, implement this knowledge for wider changes. If not, go back to the beginning of the cycle and begin again from Plan.
By filling in the TileBoard Action Form, you and your team can determine and share a smart corrective action plan for increased productivity. The brief effort it takes to log instances of downtime in TileBoard will make troubleshooting easier and more informed when bottlenecks occur or come the time for the team to debrief in general.
The TileBoard Action Form enables the person completing it to identify exactly which machine has been down, the cause for downtime, duration, and frequency, as well as the solution required to remedy the downtime event, the person responsible for doing so, and a task completion deadline. Details keyed into the form need only be brief and are easy to share by screen capture or setting an alert if you’re in charge of the action plan.
Following the PDCA Cycle allows you to collect real-time data and use a systematic approach to determine a plan, carry it out, check the steps taken toward the solution, and then act accordingly after trying out the plan or solution.
Benefits of a Digital Action Plan
It’s easy: Log downtime events in TileBoard immediately when they happen. It’s easy to track and share the information with your team or to issue alerts with screen captures shared instantly by smartphone, tablet, television, or computer.
It's collaborative: When all team members have access to the data and are aware of downtime issues, they can contribute to the solution together. This makes sticking to the plan easier. It's productive in the short- , and long-term.
It’s scaled to fit: Forget about having to sort through spreadsheets and printing them before you can analyze the numbers. This also produces unwanted paper and keeps you away from the factory floor. Filling out the Digital Action Plan in TileBoard can be done in real-time. This allows you and your team to focus on planning, doing, checking and acting. If the initial solution doesn’t work, try assigning a different one and follow the PDCA Cycle again without sacrificing more time and resources.
Worximity is deeply committed to the philosophies of Continuous Improvement and Lean Manufacturing in food manufacturing. Using our IoT technology we provide company wide visibility into the statistics that matter to manufacturers and accelerate TTV (Time to Value) of investments in company culture and training to achieve outstanding productivity.


