
Overall Equipment Effectiveness (OEE) is an important tool in lean manufacturing and continuous improvement. Considered today to be a best practice in manufacturing, the technique an theory was developed in the 1960s by Seiichi Nakajima as extension of the Kaizen system in Japan.
One of the primary benefits of OOE is that it consolidates numerous KPIs into a single score, which allows an immediate window into the total efficiency of a shop, shift, or even a single machine. It does this by providing a framework for measuring productive manufacturing time, and giving a percentage based on the collected data according to three metrics.
These metrics are defined as follows:
Quality: The percentage of faulty parts produced during production time.
Performance: The speed of production compared to the theoretical fastest time per part.
Availability: The amount of downtime (planned or no) during scheduled production time
Zooming in further, these metrics are actually a simplified form of what is known as the Six Big Losses. Quality Loss consists of startup rejects and production rejects, Performance Loss consists of small stops and slow cycles, and Availability Loss consists of planed and unplanned stops. By examining production inefficiencies form the large scale to the small scale, OEE allows factories to pinpoint specific pain points, and undertake specialized improvement projects.
In the OEE system, a score of 100% represents the theoretical best output (no faulty parts, maximum possible speed, no stops), and a score of 0% represents a total shutdown (any metric being 0% during production time). In real life an OEE score of 100% is obviously impossible, but carefully measuring a current process against its ideal form is a necessary to understanding where improvements can be made.
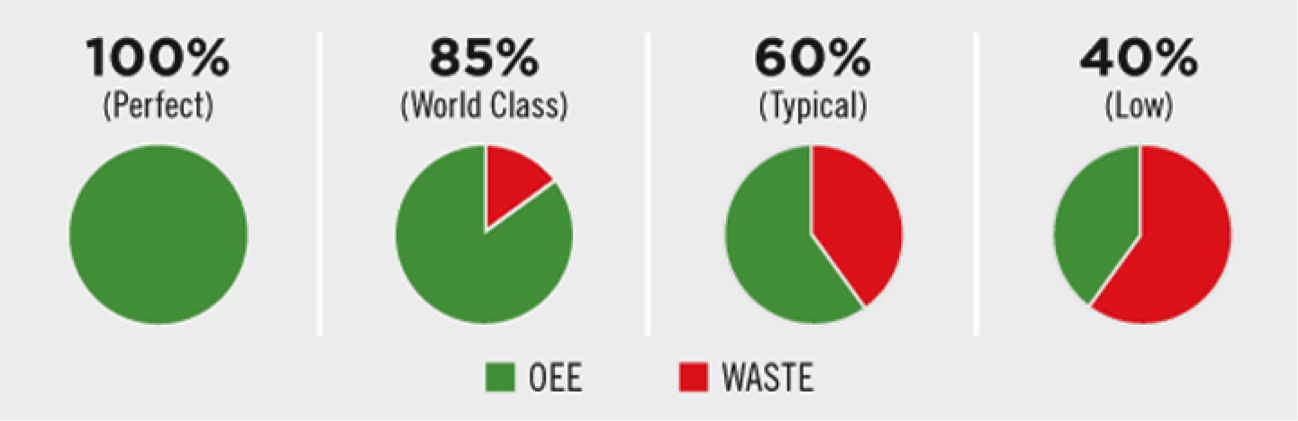
OEE KPIs Courtesy https://www.leanproduction.com/oee.html
Today, the high-water mark for discrete manufacturing is an OEE of 85%, with the average company coming in around 60%. It can be understood that 85% is a good long-term goal for these companies, as that appears to be that OEE score appears to be the high end of what’s today factories can currently achieve. Even an OEE of 40% is not uncommon, but this is often because those manufacturers are not measuring any metrics at all to drive improvement.
One of the important things to note for the plants that do use OEE for actionable insights, however, is the necessity of including consequential metrics (also known as secondary metrics) along with the KPIs. Say a company was to rush in with a poorly thought out plan to increase production speed. This might appear to improve the OEE, but at the same time it could severely increase downtime due to wear on the machine. Although overall effectiveness rises, a better method should be researched.
Finally, each company will have its own way of doing things, and there are many different versions of OEE to account for different preferences. The most important thing to remember is any variation is useless without careful, diligent, and consist data collection. But with the right structures in place, manufacturers can use their OEE score as a powerful tool of continuous improvement.
Additional Resource:
https://www.flexography.org/industry-news/overall-equipment-effectiveness-oee-manufacturing/
Worximity is deeply committed to the philosophies of Continuous Improvement and Lean Manufacturing in food manufacturing. Using our IoT technology we provide company wide visibility into the statistics that matter to manufacturers and accelerate TTV (Time to Value) of investments in company culture and training to achieve outstanding productivity.