5/6/18

Visualize the uses of AI and analytics with this interactive tool

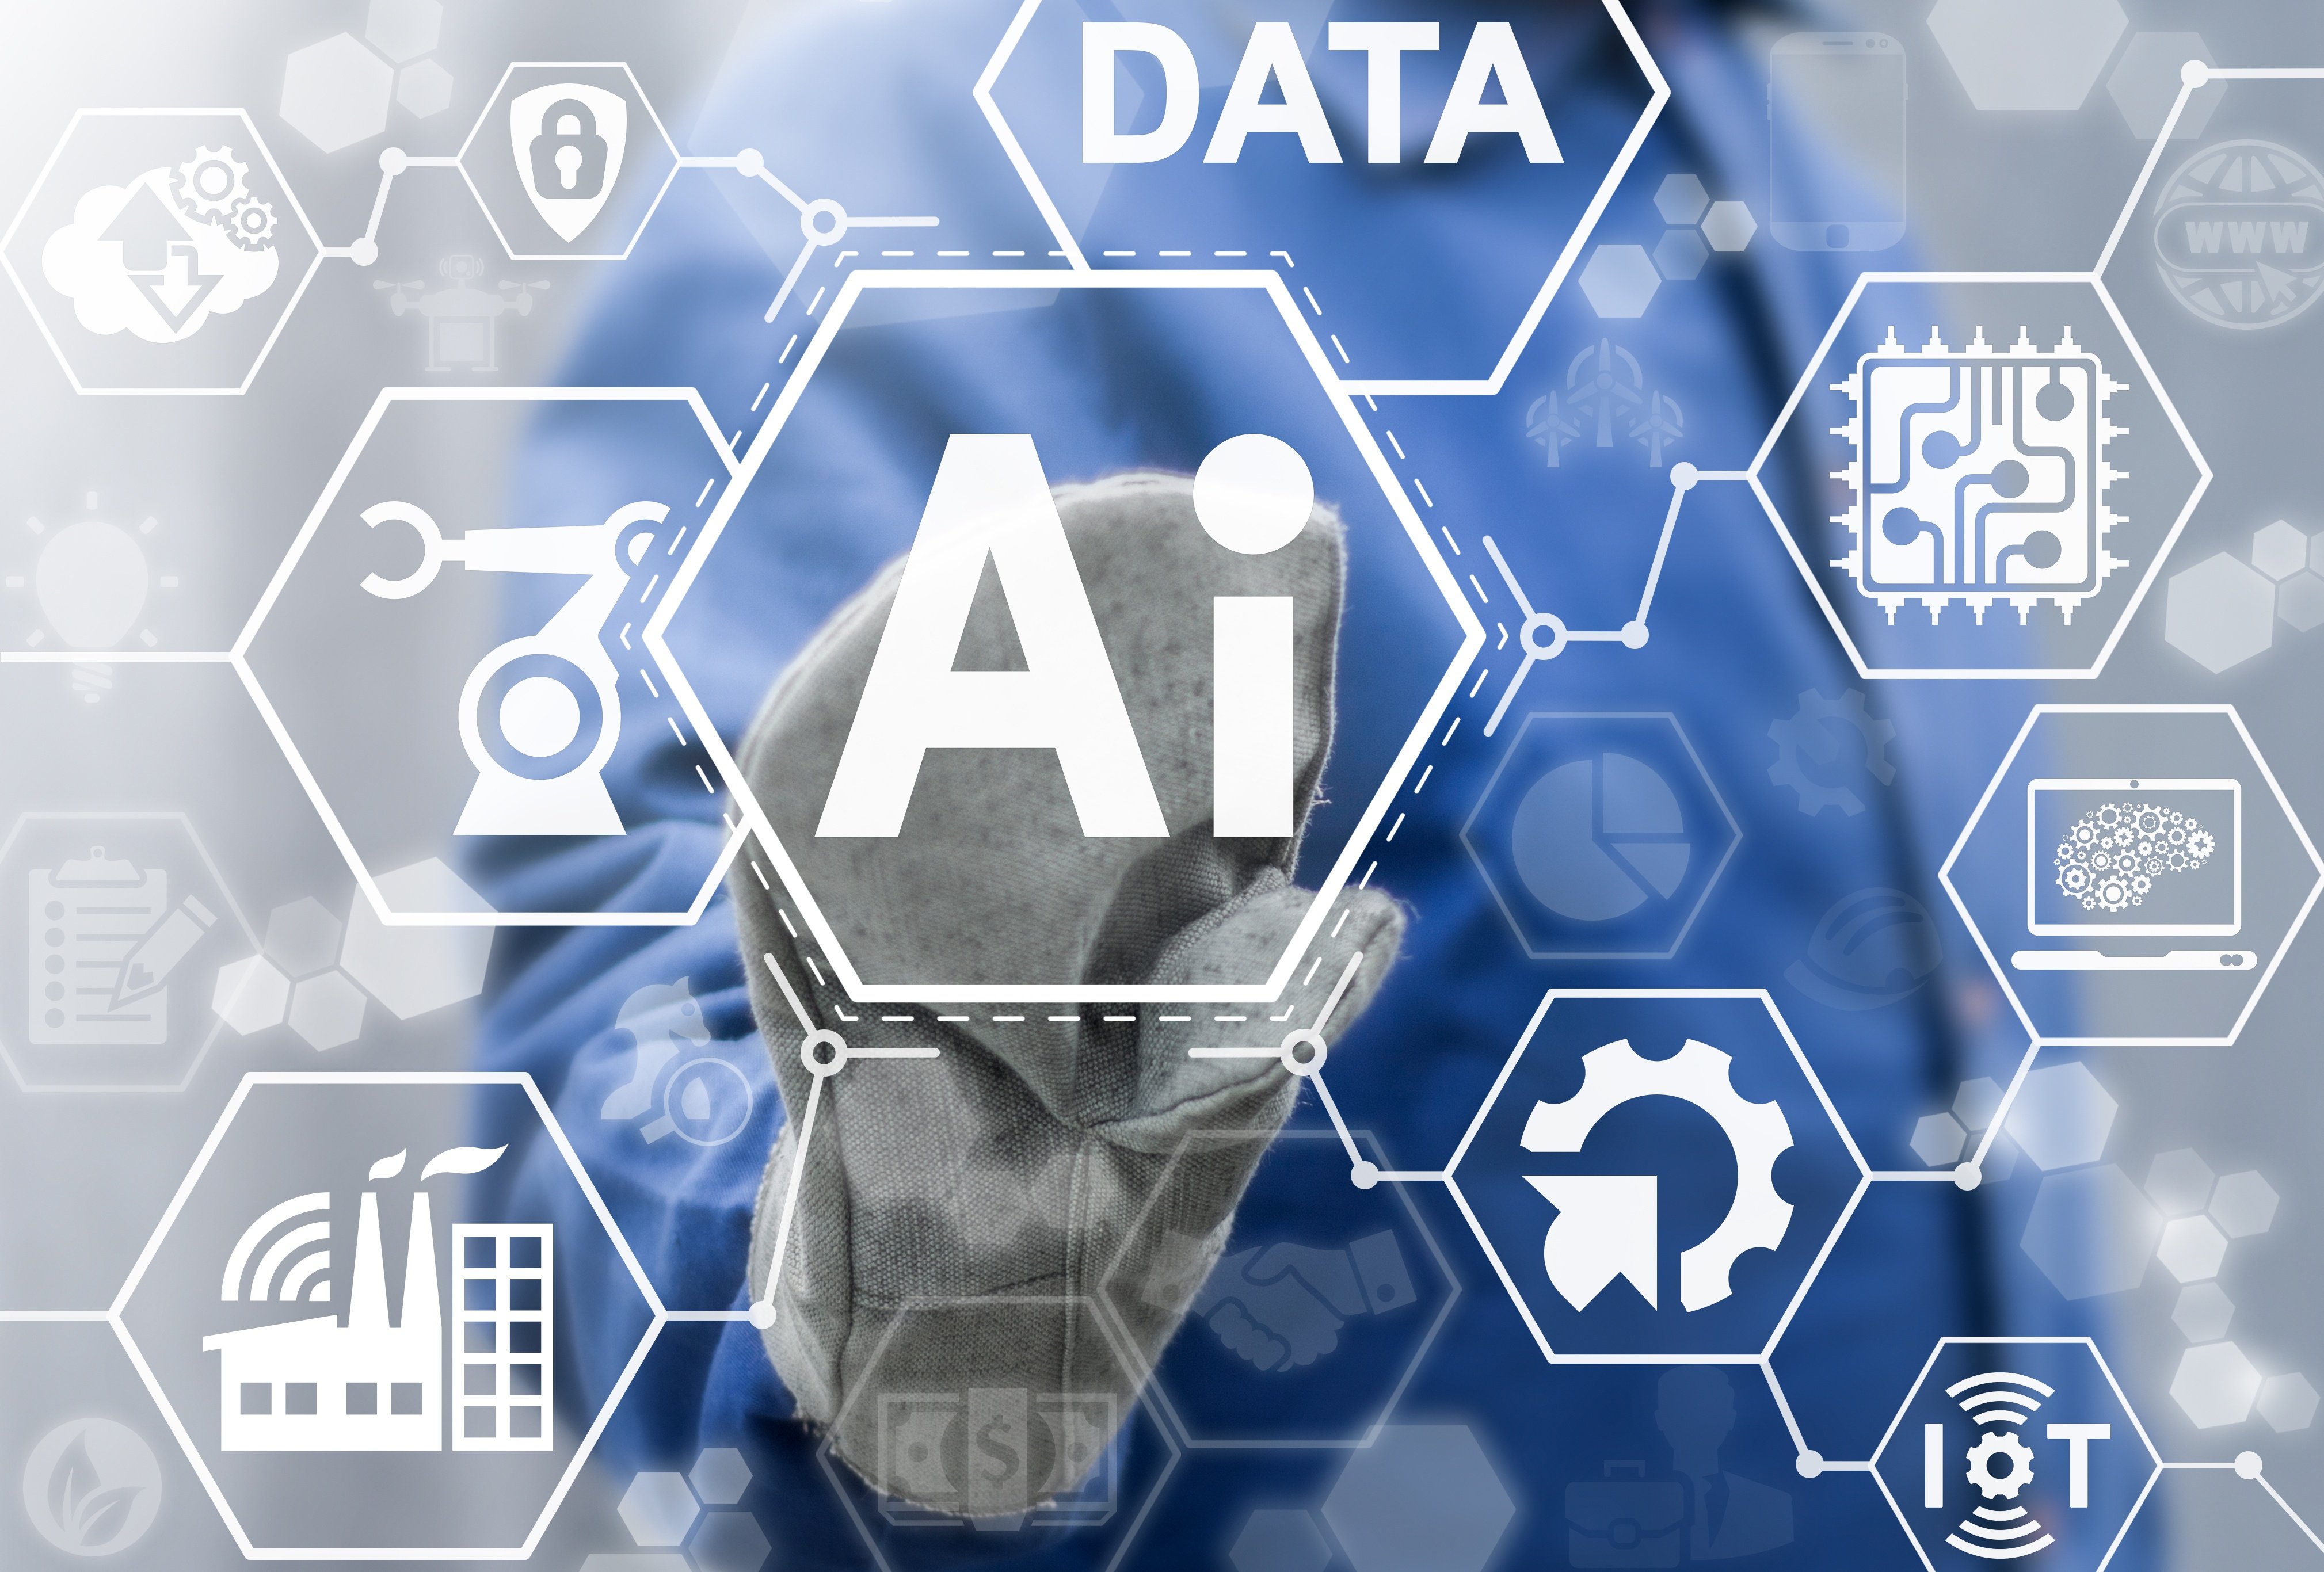
McKinsey's interactive data visualization shows the potential value created by artificial intelligence and other analytics techniques for 19 industries and nine business functions.

Artificial Intelligence
Visualize the uses of AI and analytics with this interactive tool

Related articles

Back to the blog
Thank you! Your submission has been received!
Oops! Something went wrong while submitting the form.
17
Aug 2018

5 Digital Transformation Predictions for 2018 - an infographic

English
6
Jun 2018

10 Ways Machine Learning Is Revolutionizing Manufacturing In 2018

English
20
Dec 2018

A New Look on the Food Processing Industry with AI

English

Related articles

Back to the blog
Thank you! Your submission has been received!
Oops! Something went wrong while submitting the form.
12
Nov 2021

Top Elements to Look for When Evaluating Process Manufacturing Software

Without digital factory tech, your operation will lose productivity. Learn how to evaluate process manufacturing software and update your facility.

English
20
Aug 2019

Partnership - The difference it makes!

Using Worximity’s TileConnect Smart Sensor, Jidvei Wines will be acquiring real-time data, presenting actionable KPI’s and analytics to communicate.

English
1
Oct 2021

Why the Food and Beverage Processing Industry Can’t Afford Incomplete Data

Having reliable data in your food and beverage processing lines will increase your OEE and competitive advantage.

English