
ENTERPRISE
Gain performance and profitability across all your sites.
We are looking for talents in
marketing
Worximity closes the gap between what you know and what you gain.
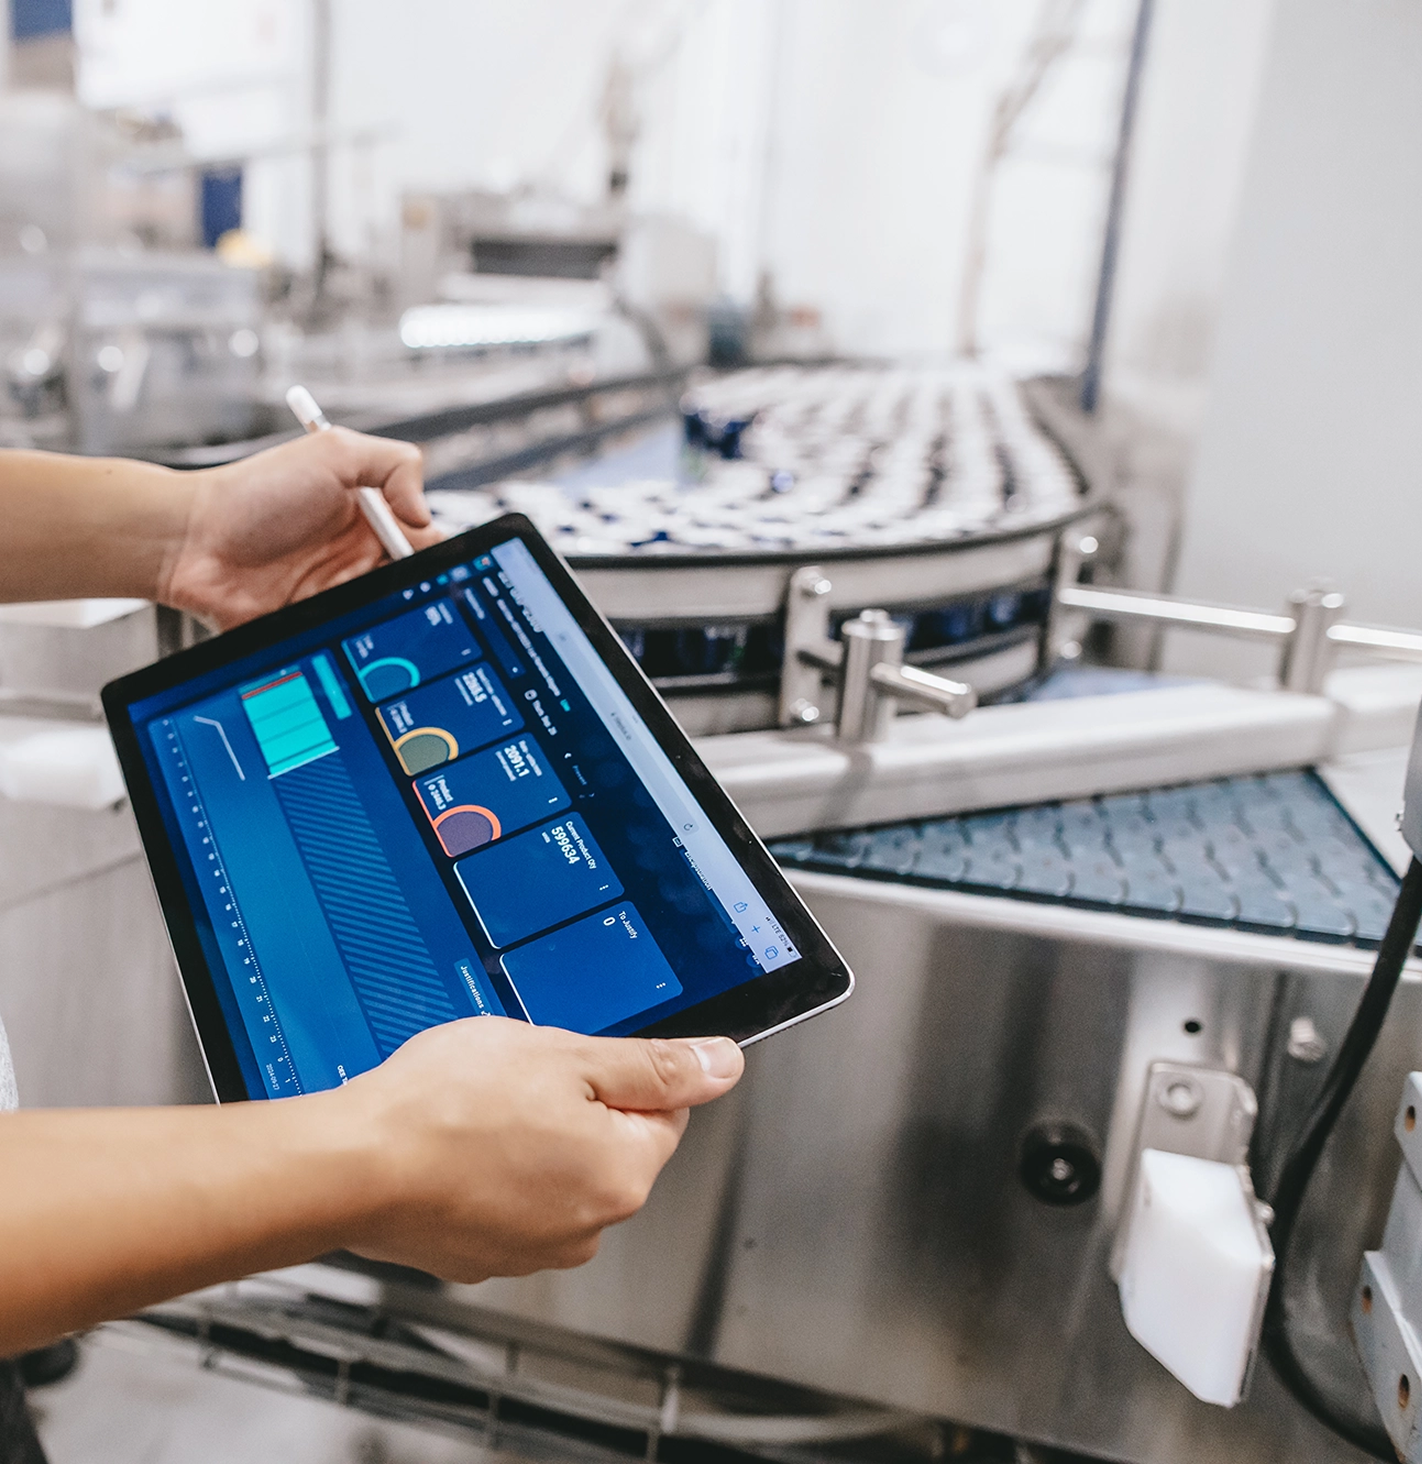
FROM DATA TO PROFIT
It's not what a plant knows that makes it more profitable. It's what it does with that knowledge.
Worximity orchestrates and accelerates that action, from the moment an event is detected to the moment it's resolved. Every signal triggers a priority, every priority triggers a tracked action, every action gets measured, and every measured gain standardizes how the next one gets achieved, faster, across every line, in every plant in your network.
Trusted
by many


THE CHALLENGE
Turn fragmented plant performance into one operating model.
Enterprise manufacturers often run different systems, KPI definitions and improvement routines from one plant to the next, making performance hard to compare and progress hard to repeat.
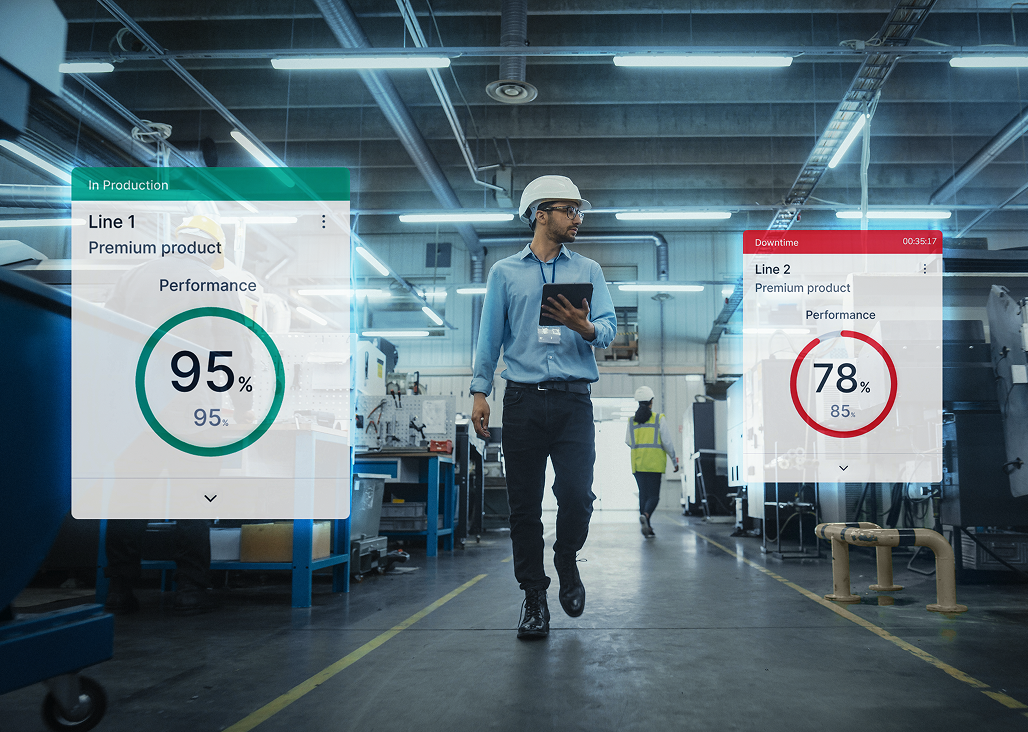

Disconnected machine, line and site data.

Inconsistent OEE, downtime and loss definitions.

Slow escalation from signal to action.

Local wins that don't replicate network-wide.
MULTI-SITE OPERATIONS
One operational truth across the manufacturing network.
Worximity gives plant leaders and enterprise stakeholders the same performance model, so sites, lines and shifts can finally be compared on the same terms.
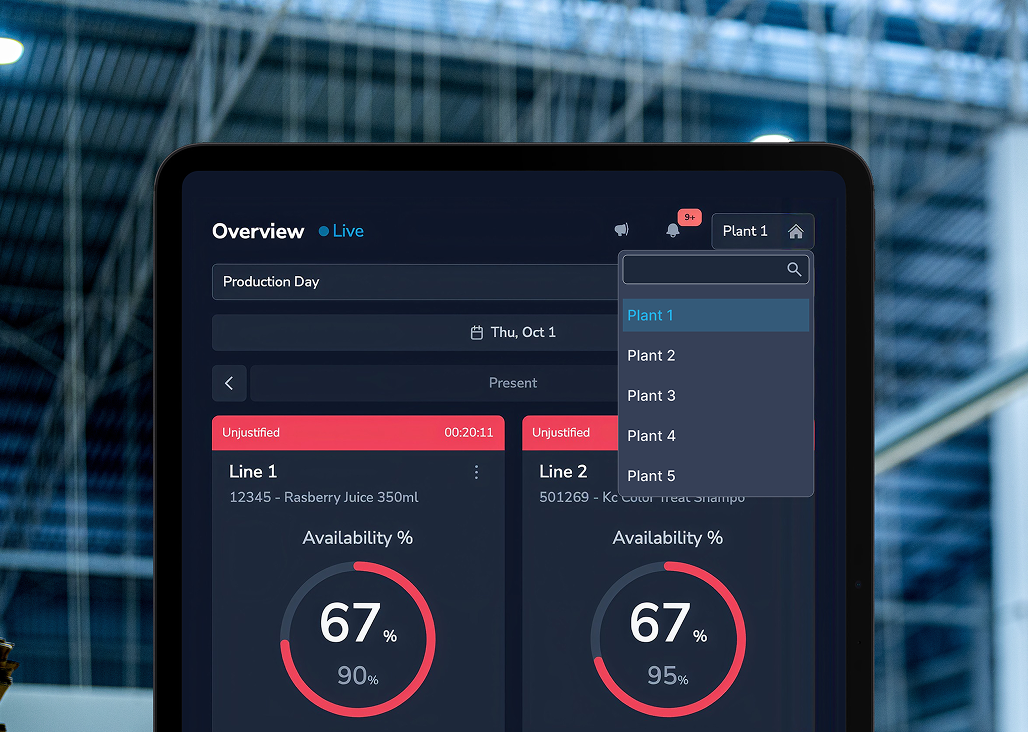

Benchmark plants, lines, shifts and periods.

Roll up site data into one corporate view.

Drill from network view to line-level loss.

Standardize how performance is measured.

Pair local action with network visibility.
AI-POWERED OPERATIONAL INTELLIGENCE
Your manufacturing data, made actionable by AI.
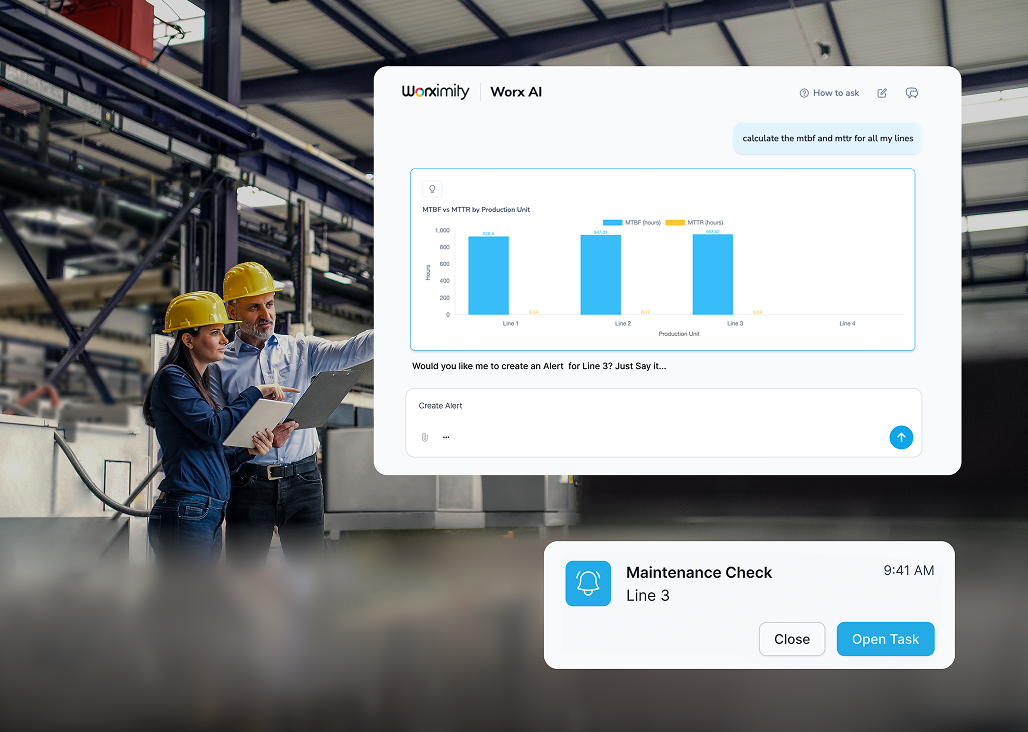
Worximity AI surfaces recurring loss patterns and points teams to the highest-value opportunities, accelerating analysis without replacing the judgment of experienced operations leaders.

Detect recurring loss patterns across sites.

Prioritize each plant's highest-value opportunity.

Speed up root-cause investigation.

Generate clear, executive-ready performance summaries.

Recommend the next question or action.
Connected execution
Move from insight to accountable action.
Dashboards don't improve performance on their own. Worximity connects real-time production events to the alerts, workflows and action plans that help teams respond and sustain the gain.
- Alert when performance drifts or thresholds slip.
- Launch the right form or work instruction.
- Assign actions with clear owners and due dates.
- Connect quality, yield and giveaway to line performance.
- Track completion, and whether it actually improved.
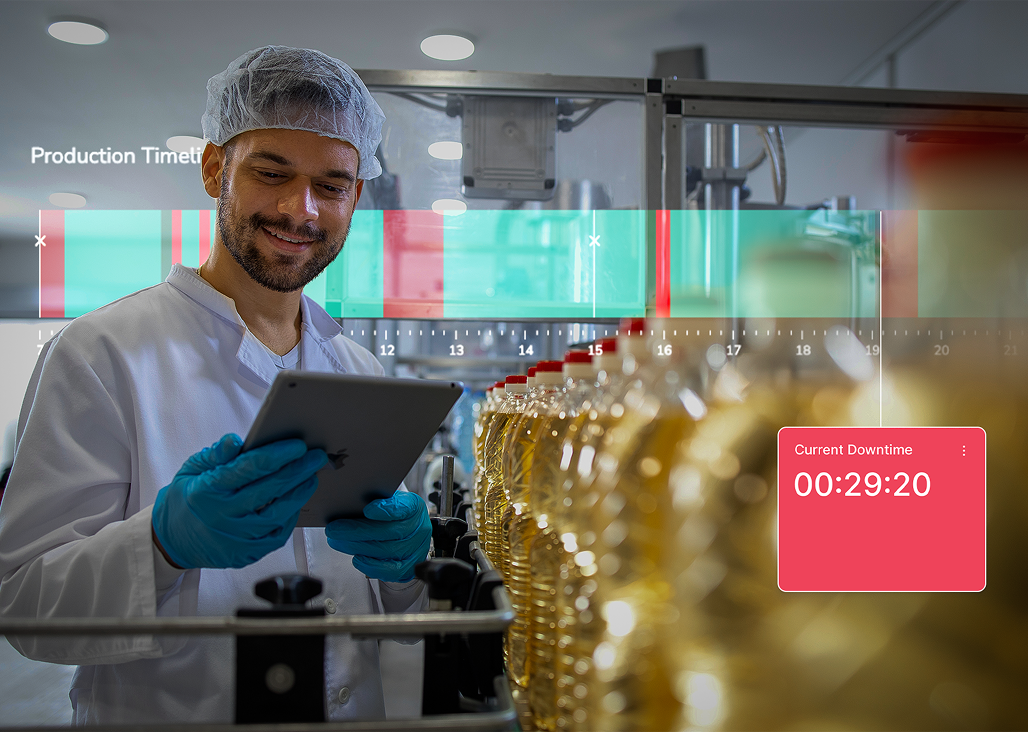
Visibility identifies the issue. Connected execution changes the outcome.
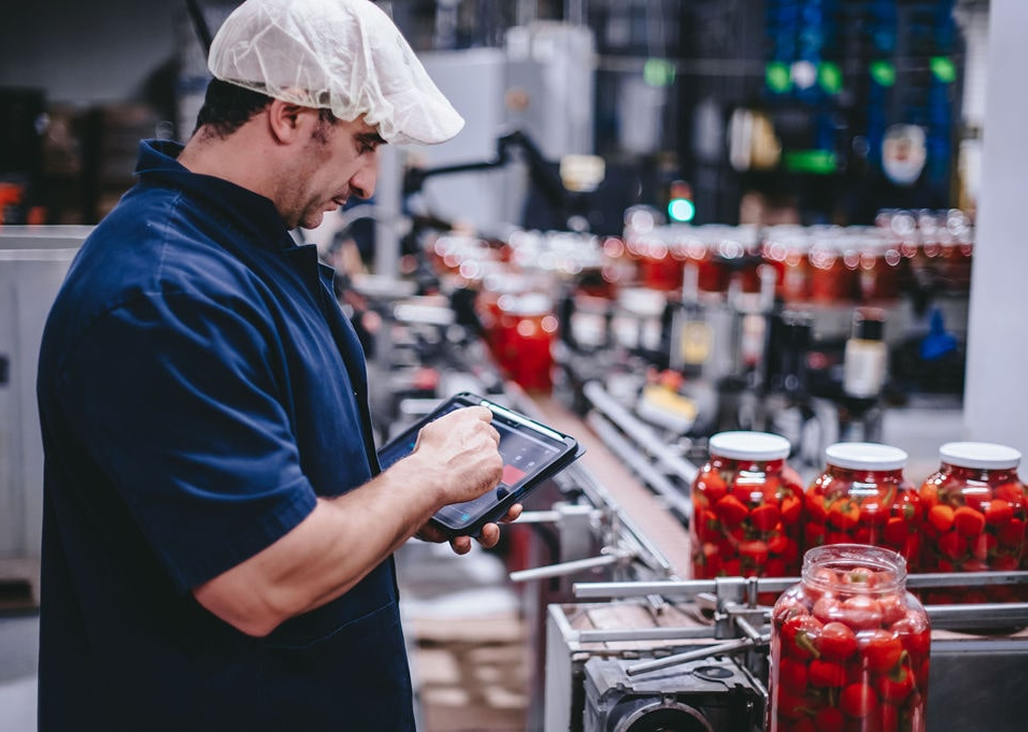
Technology creates visibility. The operating cadence turns visibility into lasting value.
DEPLOYMENT & CUSTOMER SUCCESS
Start fast. Prove value. Scale with confidence.
Manufacturers start with a clearly defined priority, prove measurable value fast and expand through a repeatable rollout, with Worximity operations experts alongside plant teams at every step.
- Align on outcome, baseline and success criteria.
- Connect a priority line and set the operating cadence.
- Standardize KPIs, then validate adoption and results.
- Roll out site by site with proven playbooks and change management.
- Sustain and expand value through coaching and structured QBRs.
ARCHITECTURE & GOVERNANCE
Enterprise control, built on your existing OT and IT stack.
Worximity adds a real-time performance and execution layer without rebuilding your technology stack, and gives corporate, regional and plant teams the access and governance they need without complicating the floor.
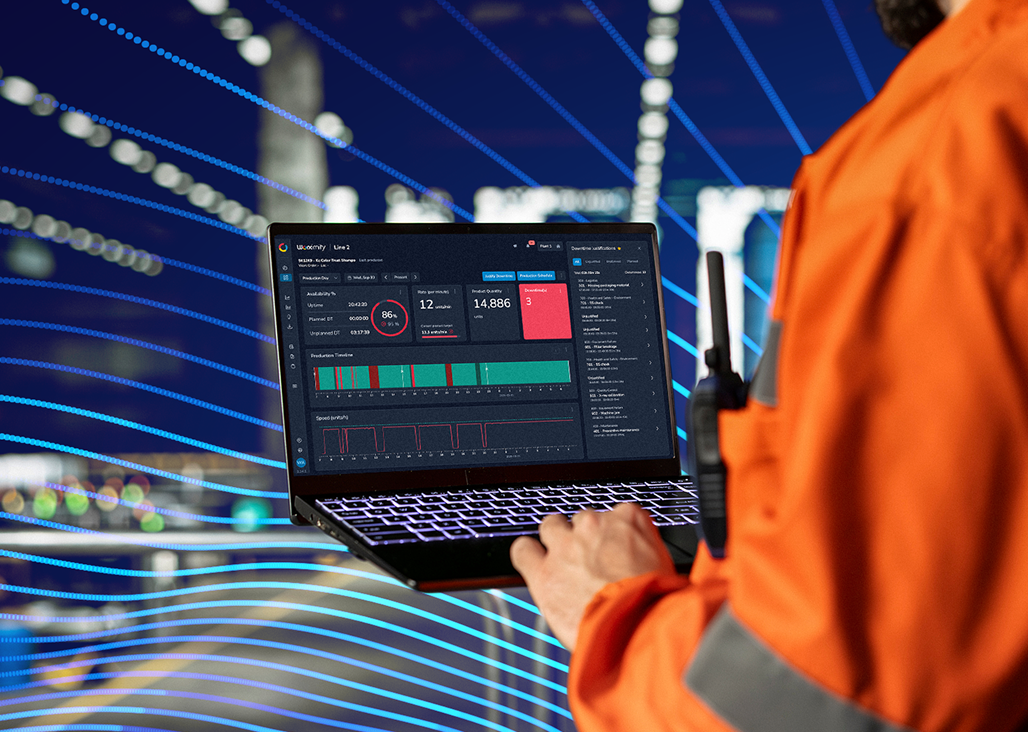

Connect machines, PLCs and line-level data.

Integrate with ERP, MES, BI and enterprise systems.

Enable secure APIs and flexible data flows.

Role-based access and standardized KPIs, from corporate to line.

Security and access documented for IT review.
Customer outcomes
Results that compound across sites.
Worximity helps manufacturers move from isolated wins to repeatable gains. The strongest proof isn't one line improving, it's how fast that improvement repeats network-wide.
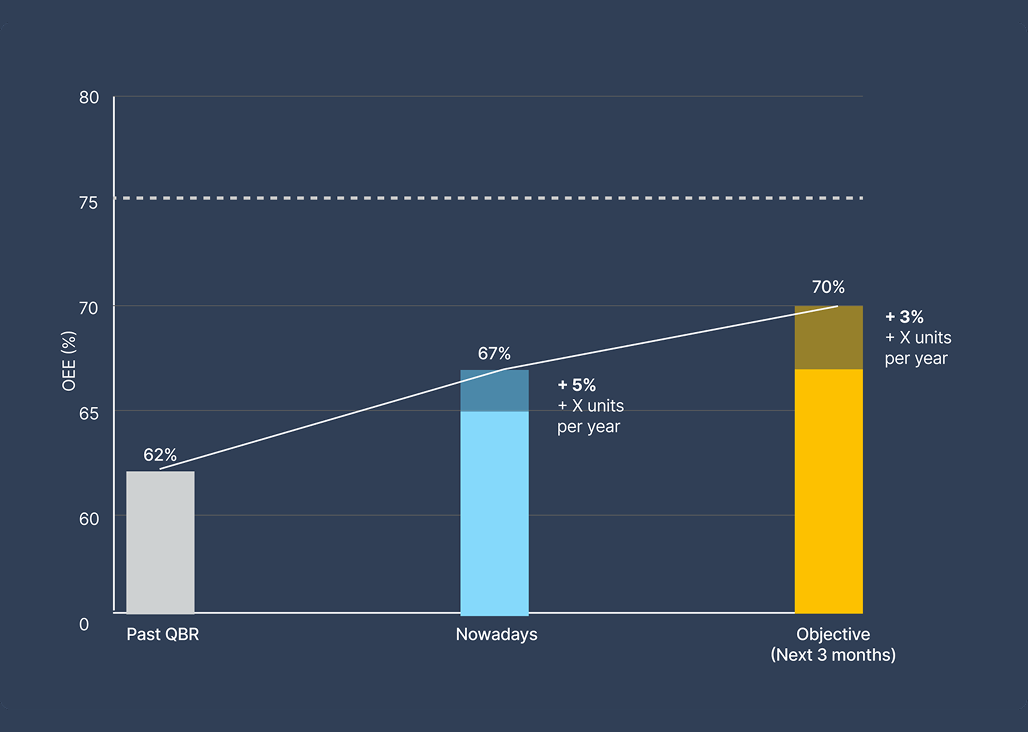

Throughput: more output, no added capital.

Labor: more output per labor hour.

Yield and waste: less giveaway, fewer rejects.

Consistency: benchmark sites, replicate what works.

We began to see real value within just a few days. Teams could step back, identify the most significant sources of loss, and prioritize actions.
Ready to build one performance system across your plants?
See how Worximity connects your production data, surfaces the highest-value opportunities and builds a repeatable model across your network, around your priorities, not a generic product tour.
BOOK AN ENTERPRISE DEMO