24/10/17

How LOL TUN Improved Its Uptime by 20%

Since LOL TUN started using TileBoard, managers have seen productivity improve by more than 10%.

Smart Factory
How LOL TUN Improved Its Uptime by 20%
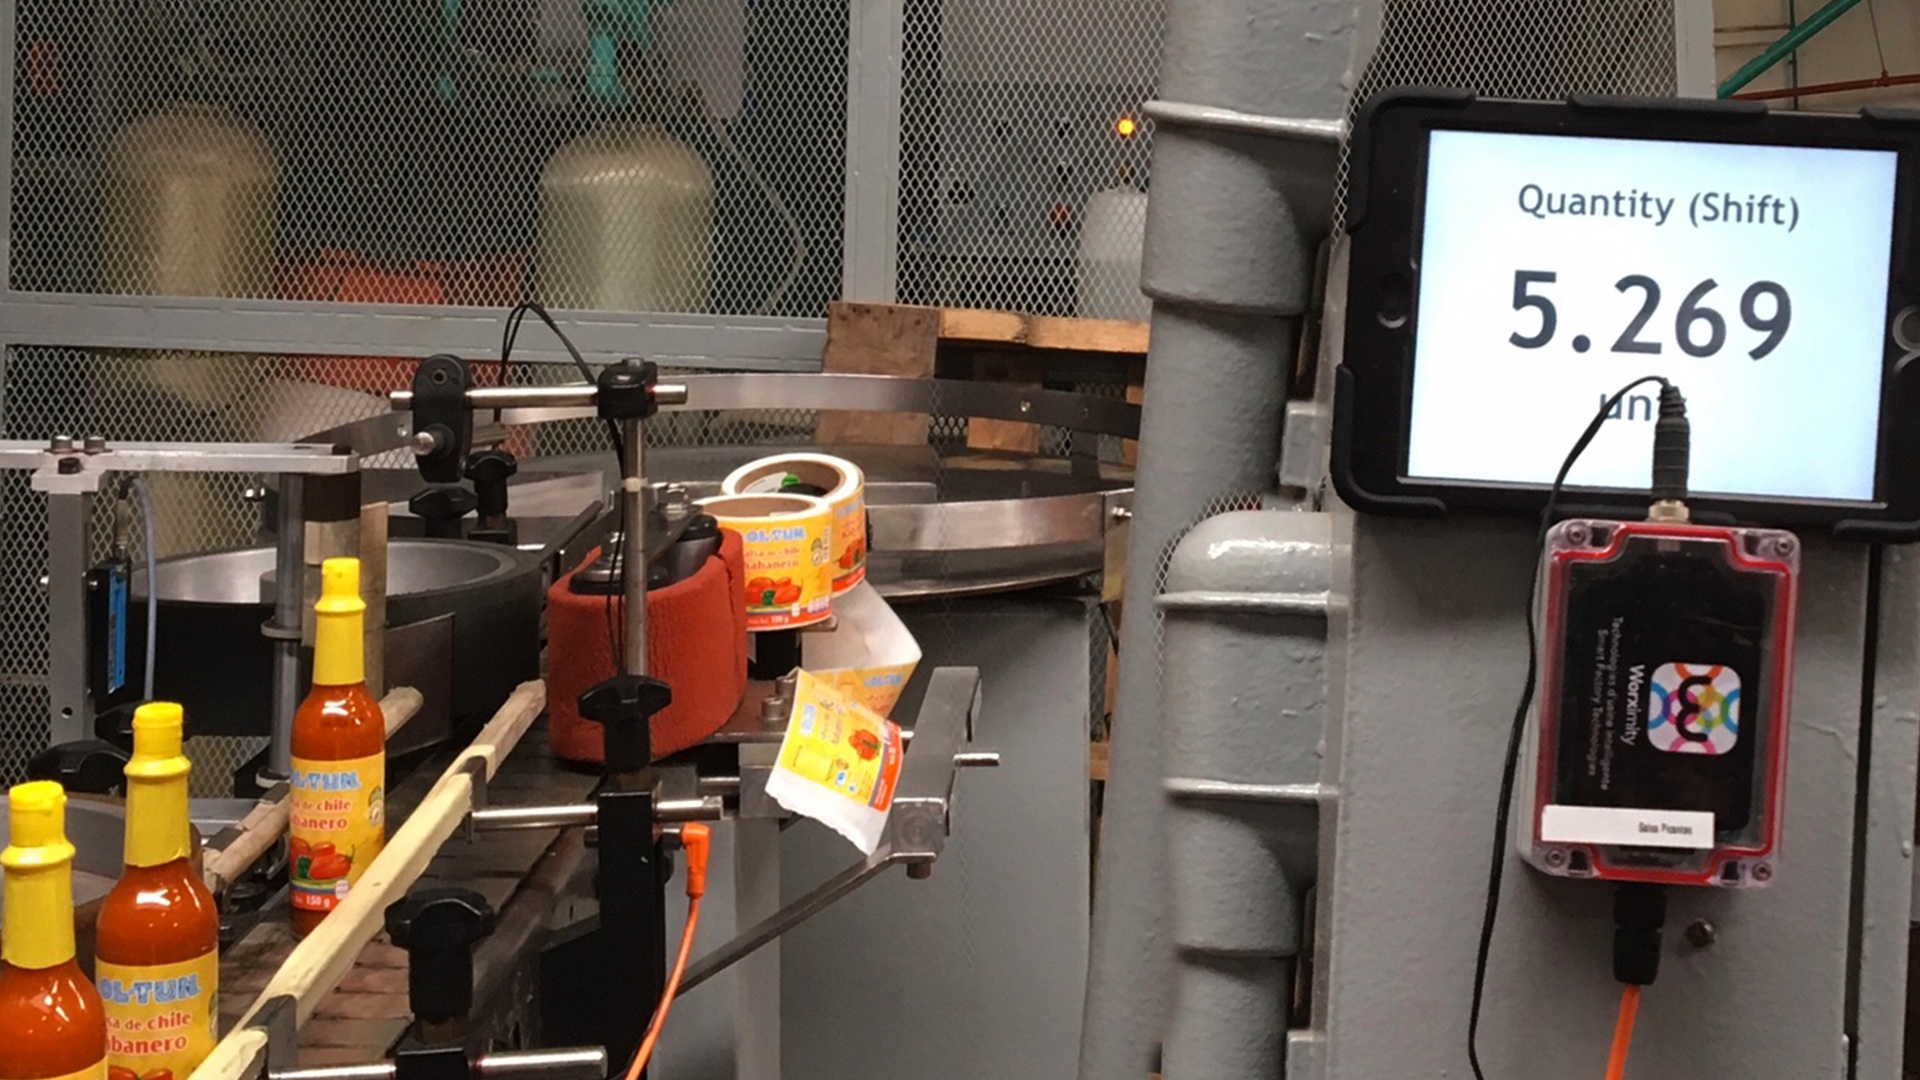
Since LOL TUN started using TileBoard, managers have seen productivity improve by more than 10%, thanks to higher unit volumes produced and a significant reduction in downtime.

Productos Lol-Tun S.A. de C.V. is a Mexican manufacturer of hot sauces and condiments in operation for more than 30 years, with products exported to over a dozen countries.

LOL TUN had no real-time production data and was looking for a tool to better control its production. They wanted to increase production volume in their hot sauce plant and know precisely when SKUs changed on the lines. The client also targeted a reduction in the quantity and duration of downtime to increase uptime. Finally, the company wanted to evaluate the profitability of new products based on their production rate.

Jahziel Ugalde Angeles was our digital champion at LOL TUN and drove the rollout of Worximity's smart technologies inside the plant. Concrete, impressive results were visible just 4 weeks after activation. Production volume increased from 9,375 units to 14,032 units per week. In only a few weeks, a 20% improvement in uptime was achieved, along with 25% savings on total downtime costs.

"Because employees are aware of their impact on production, downtime was reduced without any other continuous improvement initiative. Employees were diligent in cutting changeover times and reacting faster when issues hit the line. Over time, as I get better at using the application, I will identify even more improvement opportunities and benefits tied to TileBoard." - Jahziel Ugalde Angeles, LOL TUN, VP Operations

Want to learn more?
Download the ebook
Related blog articles

Related articles

Back to the blog
Thank you! Your submission has been received!
Oops! Something went wrong while submitting the form.
4
Mar 2019

Looking for a solution to the labor shortage?

English
30
Mar 2020

Industry 4.0 — driving change in manufacturing and operations

English
2
Jul 2019

Succeeding in Industry 4.0 with Agile Leadership

English

Related articles

Back to the blog
Thank you! Your submission has been received!
Oops! Something went wrong while submitting the form.
Hand interacting with a futuristic digital interface displaying “2024,” AI icons, and technology symbols, representing emerging technology trends, artificial intelligence, digital transformation, innovation, and future-focused business strategy.
9
Jan 2024

Manufacturing Trends to Lookout for in 2024

As we look at manufacturing trends for 2024, pressure to stay on top of current trends and maintain competitiveness are at an all-time high

English
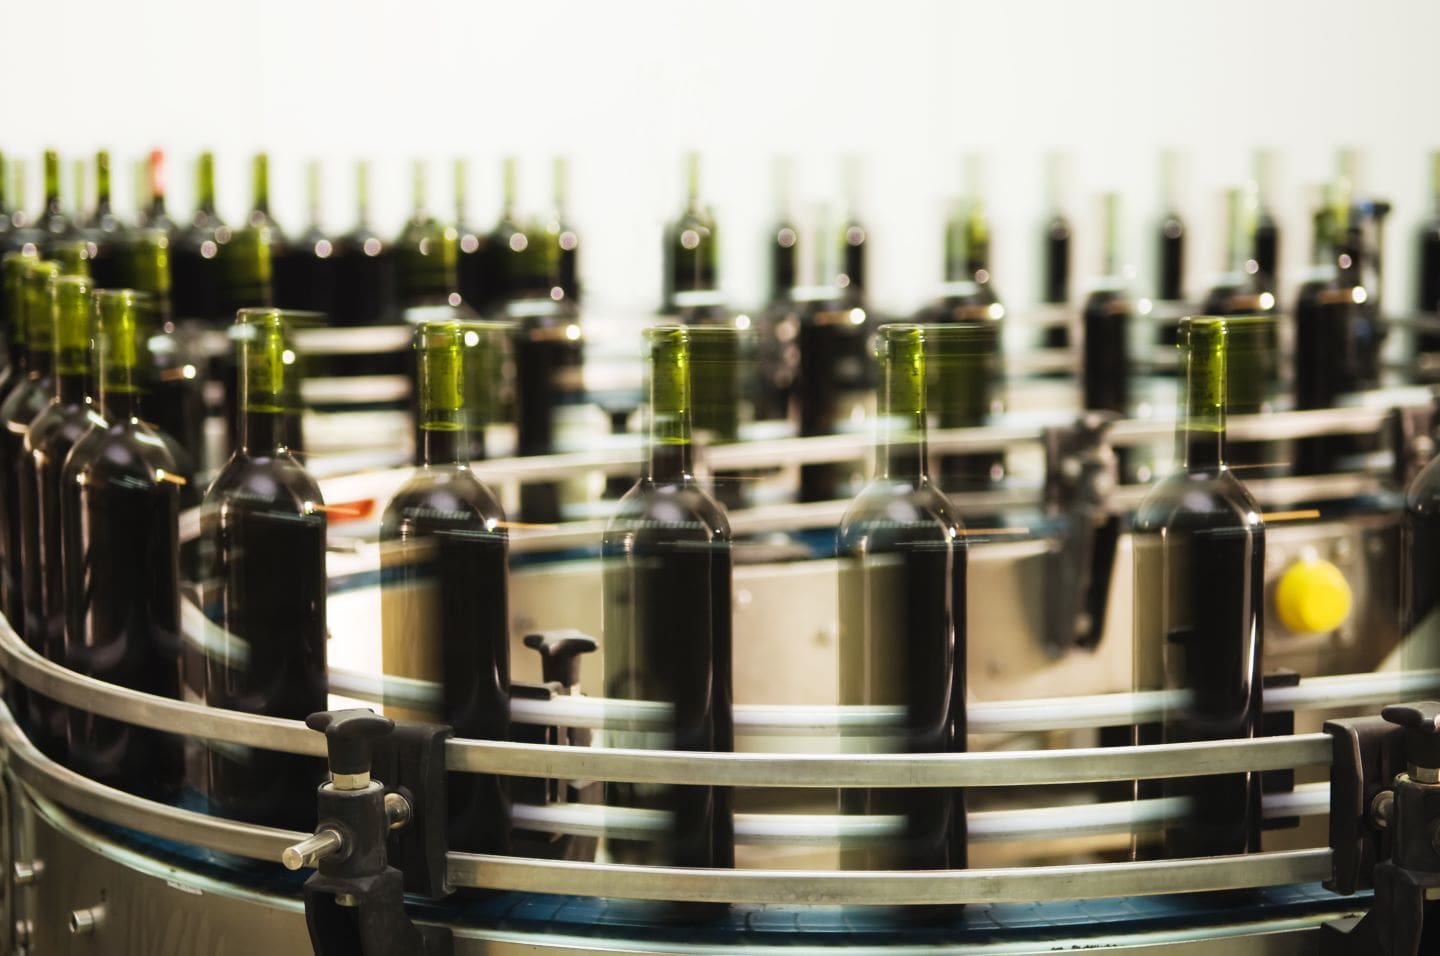
Automated bottling and packaging line in a manufacturing facility, with glass bottles moving through production equipment, representing production throughput, manufacturing output, operational efficiency, and process performance.
5
Dec 2023

Understanding takt time in manufacturing

Through real examples and practical insights, discover why measuring and monitoring takt time is the path to optimized production.

English
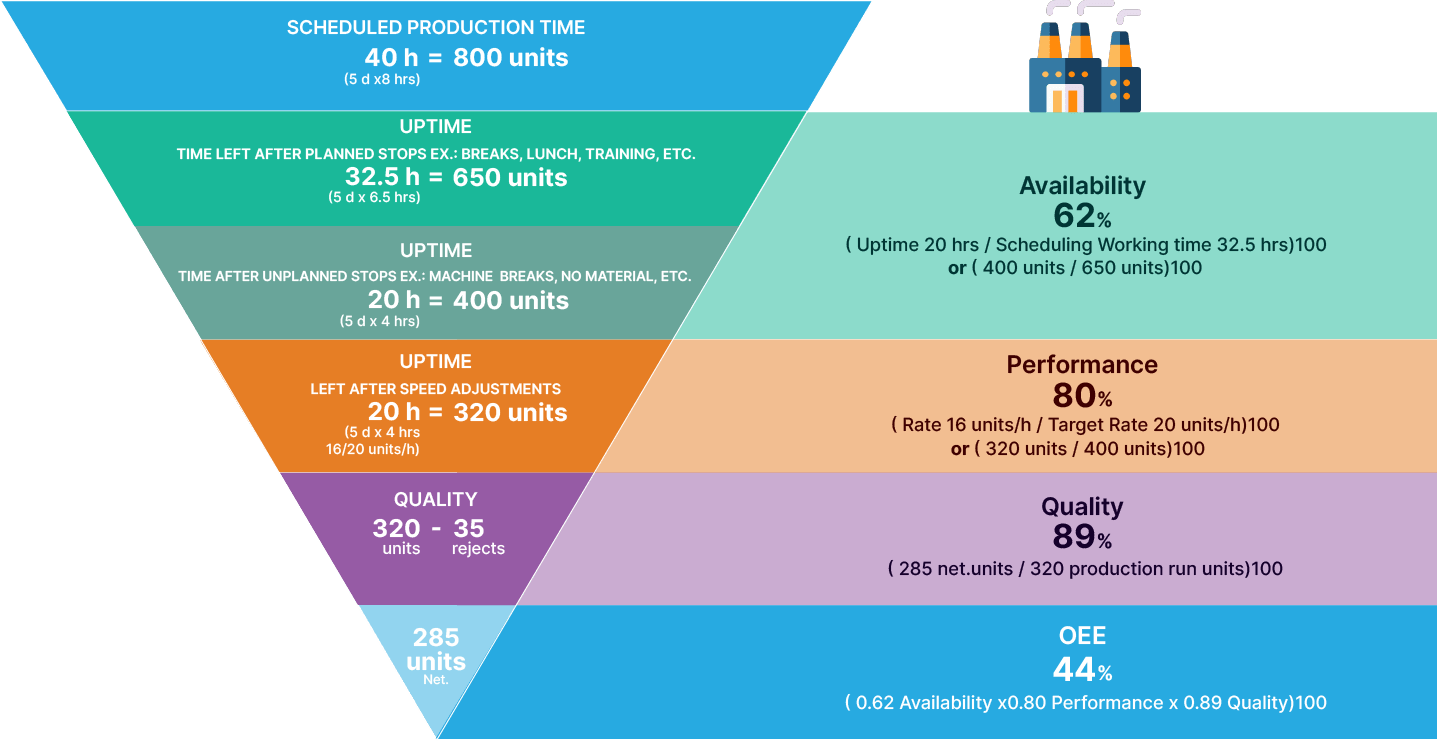
nfographic illustrating the major sources of Overall Equipment Effectiveness (OEE) losses in manufacturing, showing categories such as downtime, speed losses, and quality losses that impact production performance and operational efficiency.
15
Nov 2023

Decoding the OEE Calculation: Translating OEE Metrics into Tangible Losses

The following OEE funnel is a great way to visualize how losses in availability, performance, and quality impact OEE and your throughput.

English