Every product is built in stages: receiving, preparation, processing, filling or forming, packaging, shipping. Each stage adds cost in ingredients, energy, labor and machine time. By the time a product reaches the packaging line, it carries most of its total cost. Packaging is the last stage of value-adding, and the point where everything upstream either becomes saleable product or doesn’t.
The 2026 economy makes that point harder to ignore. In the National Association of Manufacturers’ Q3 2025 survey, cited in Deloitte’s 2026 Manufacturing Industry Outlook, 78% of manufacturers named trade uncertainty as their top concern, and respondents expected input costs to rise by an average of 5.4% over the following year. Skilled labor is scarce, and new equipment costs considerably more than it did a few years ago.
Several levers run through the whole process
At every stage of production, these levers determine what a plant earns:
- Throughput: how much good product the line makes per scheduled hour.
- Quality: how often it is right the first time.
- Process yield: how much of what you bought leaves the plant as product you can sell.
- Labor productivity: how much good product each person on the line helps make.
These apply from the first mixer to the last case packer, and they matter most where cost has piled up.
Where packaging sits in your cost picture
Packaging’s share of production cost depends heavily on the product. Canned foods and beverages can see packaging above 20% of production costs, categories such as ready meals, dairy and infant formula tend to fall between 10% and 20%, and lightly packaged products like bread and poultry sit near 5%. In Canadian beverage manufacturing, packaging accounts for roughly one-third of raw material costs, according to FCC.
That share understates its weight, for three reasons:
- Value is stacked by the time it arrives. A pack rejected at the end of the line takes the product, labor, energy and packaging material with it. The same scrap rate costs more here than at the start.
- Hidden capacity shows up here. Micro-stops, long changeovers and slow running cost the same overhead as a productive hour, and they rarely get a work order.
- It is the last chance to recover. Anything lost upstream is already sunk. Fill accuracy, first-pass rate and stops at the packaging line still decide how much accumulated cost turns into revenue.
The packaging line is a modest slice of cost with a large lever on everything before it. Here is what we hear most from the plants that run these lines.
The 2026 packaging requirements
1. Get more saleable product out of every roll, carton and batch
Material is the largest cost a plant can still control. Every gram of overfill is product you paid for and gave away. Every carton, label or length of film scrapped was purchased, shipped and stored, then discarded.
Prices are rising. FCC’s price index shows 2025 increases of 4.1% for glass products, 2.5% for light gauge metal containers and 1.3% for plastic bottles, with steel and aluminum tariffs adding pressure on cans. When inputs cost more, each point of material yield is worth more. Less waste also means a smaller environmental footprint and less material to buy, dispose of or report under extended producer responsibility (EPR) programs.
2. Make it right the first time, and stay compliant
Poor quality costs twice: the rejected pack, then the labor and line time to rework it. It is also a compliance issue. Underweight packs, wrong labels and unreadable codes bring regulatory risk, retailer chargebacks and recalls, and the rules are tightening. Packaging Dive’s 2026 outlook highlights new PFAS restrictions, a California labeling law and expanding EPR programs. A higher first-pass rate serves three goals at once: material, capacity and compliance.
3. Plan for fewer hands on the line
Experienced operators are retiring faster than new trades are entering, and immigrant workers filled nearly one in four U.S. manufacturing production jobs in 2024, according to Deloitte, so recruitment is getting harder. Some plants already run leaner: FCC reports that Canadian soft drink makers and breweries each cut hourly staff by around 10% in 2025 as sales softened. Automation has gone from nice-to-have to requirement, but for mid-sized plants the business case is harder, which leads to the next point.
4. Get the most out of the equipment you already own
Tariffs and scarce components have pushed machinery prices up. KPMG’s 2026 survey of Canadian manufacturers found that 57% have reduced, paused or cancelled capital spending, and 52% describe their business as being in “endurance mode.”
Before adding a line, look hard at the ones you have. Most hide capacity in unrecorded micro-stops, long changeovers and below-rated speeds, and recovering it is usually the fastest, lowest-cost investment available. Utilization also drives unit cost: McKinsey notes that in pulp and paper packaging, fixed costs of 15–25% of the cost base at full utilization can rise above 30% at about 70% utilization.
THE ROI: At Cooperl, a French agri-food cooperative that standardized performance tracking across 9 sites, average availability rose from 52% in Q1 2025 to 63% in Q1 2026. The target was a 1% OEE improvement; gains reached 8 to 9% in the first year, and the investment paid back within a few months.
5. Measure everything the same way: OEE
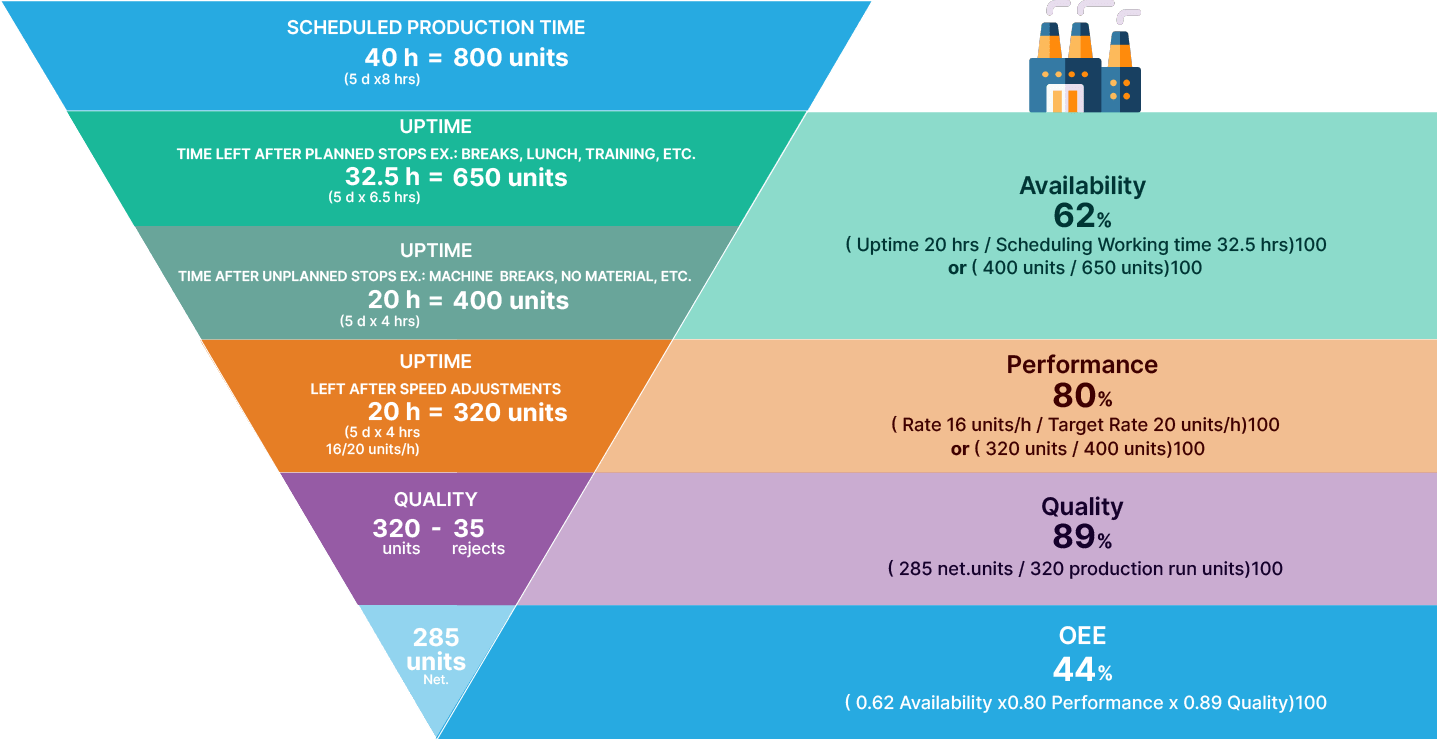
Overall Equipment Effectiveness (OEE) ties the requirements together: availability captures downtime, performance captures slow running and micro-stops, and quality captures scrap and rework. Unless it is measured the same way on every line and shift, you cannot tell which requirement to tackle first, or what it is worth.
Why these can’t be managed one at a time, or one stage at a time
Improvement programs usually optimize one metric or one department at a time, which works until a gain in one place creates a loss in another. Procurement sources a cheaper film, for example, and it jams, stops and scraps more on the line. The purchase-order savings vanish on the floor, and no one sees it because each team reviews only its own numbers.
McKinsey’s June 2026 analysis of pulp and paper packaging reaches the same conclusion. Siloed procurement, lean and energy programs no longer close the cost gap, and one global producer that moved to a cross-functional approach cut costs at individual mills by 8% to nearly 20%.
The strongest operations focus on pivot variables, the few levers that move several results at once. Scrap is one: reduce it and you lower material cost, free up labor, improve OEE, cut waste and ship on time more often.
Cost leadership no longer comes from optimizing each department. It comes from optimizing the whole system, with every team working from the same data.
Manufacturers are investing accordingly: Deloitte reports that 80% of the 600 executives it surveyed plan to put at least 20% of their improvement budgets into smart manufacturing.
What it adds up to
Every owner and plant leader wants the same three things:
- Growth: more volume from the same plant.
- Margin: more profit and EBITDA on every unit shipped. FCC forecasts a 12.4% decline in gross margins for Canadian beverage manufacturers in 2026.
- Value: a business that is worth more. As consolidation continues across food, beverage and packaging, a documented OEE record shows lenders, investors and partners that the plant performs.
Each requirement above feeds all three.
Where Worximity fits
Since 2011, Worximity has helped manufacturers bridge the gap between visibility and execution, with more than 1,500 installations on the shop floor. Our solutions connect to the lines you already run, whatever the brand or age of the equipment. We don’t replace your systems. We activate them.
- Connect: bring every line, shift and plant into one real-time view, from the first process step to the last pack.
- Measure: track downtime, speed, quality and OEE the same way everywhere, and see what each point of OEE is worth in profit and EBITDA.
- Improve: enable your entire workforce to act with the same priority and the same tool on your most cost-impacting continuous improvement initiatives, all within the Worximity ecosystem.
No new machines required. Just a clear picture of what the ones you have can really do.
Sources
- Deloitte, 2026 Manufacturing Industry Outlook (November 2025)
- FCC, 2026 Food and Beverage Report: Beverage manufacturing
- KPMG Canada, Canadian manufacturing at a crossroads (August 2026)
- McKinsey & Company, Resetting cost competitiveness in pulp and paper packaging (June 2026)
- Packaging Dive, Packaging trends outlook 2026
- Packaging Gateway, Packaging in the food supply chain