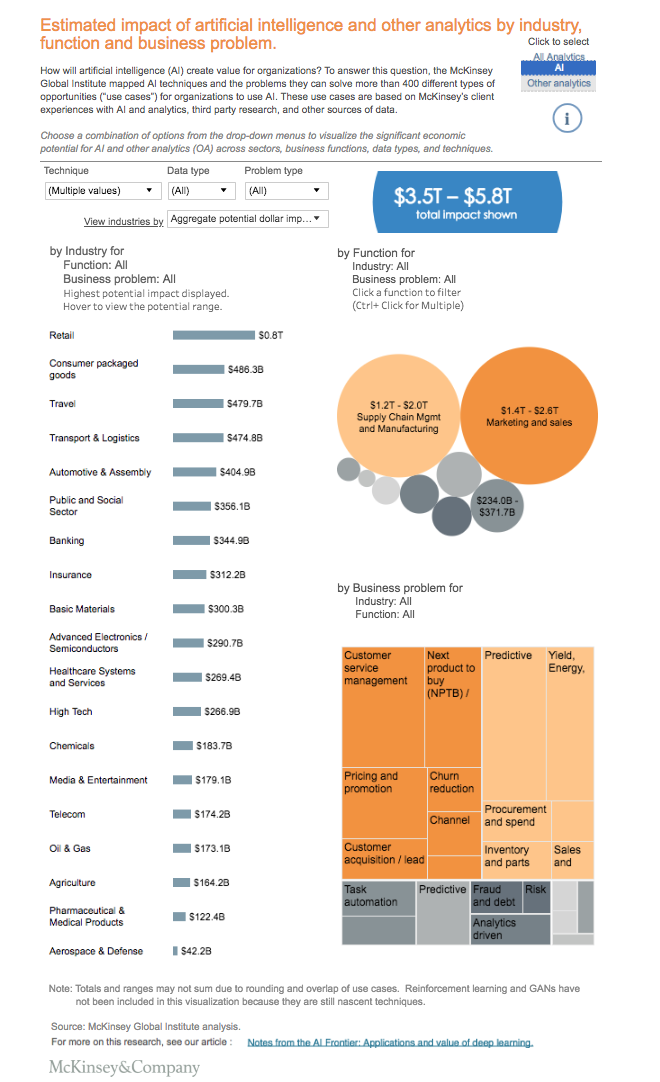
5/6/18

Visualize the uses of AI and analytics with this interactive tool

McKinsey's interactive data visualization shows the potential value created by artificial intelligence and other analytics techniques for 19 industries and nine business functions.

Artificial Intelligence
Visualiser les utilisations de l'IA et de l'analytique avec cet outil interactif

Articles connexes

Retour au blog
Nous vous remercions ! Votre demande a bien été reçue !
Oups ! Un problème s'est produit lors de l'envoi du formulaire.
20
Fév 2018

Worximity will be part of the Supercluster Scale AI

English
5
Fév 2019

A Montreal with an AI flavor

English
7
Janvier 2019

Artificial Intelligence in the Food Industry: Six areas of application

English

Articles connexes

Retour au blog
Nous vous remercions ! Votre demande a bien été reçue !
Oups ! Un problème s'est produit lors de l'envoi du formulaire.
26
Mars 2018

6 HR Tips to Succeed in the Move to Industry 4.0

Industry 4.0 is reshaping the workplace and driving significant change. Discover 6 HR tips that will smooth your transition to Industry 4.0.

English
13
Mars 2018

10 Human-Machine Interactions Boosting Productivity in 4.0 Plants

See how human-machine interactions can boost productivity in 4.0 plants and reshape the workplace.

English
4
septembre 2018

What Should a Dashboard Contain to Monitor Overproduction?

Reduce giveaway in real-time by monitoring your production lines with the TileBoard dashboard software and you will be able to reduce raw material losses, improve machine capacity, and reduce your labor cost.

English