5/6/18

Visualize the uses of AI and analytics with this interactive tool

McKinsey's interactive data visualization shows the potential value created by artificial intelligence and other analytics techniques for 19 industries and nine business functions.

Artificial Intelligence
Visualize the uses of AI and analytics with this interactive tool

Related articles

Back to the blog
Thank you! Your submission has been received!
Oops! Something went wrong while submitting the form.
9
May 2019

Will You Be Able to Catch Up to Industry Leaders? - Part 1

English
13
Aug 2018

What are the Top AI Trends of 2018?

English
19
Jun 2019

5 First Steps Towards Artificial Intelligence

English

Related articles

Back to the blog
Thank you! Your submission has been received!
Oops! Something went wrong while submitting the form.
27
Feb 2019

Data: A Precious Ressource for Manufacturers

Can data truly become one of the most valuable resource to own? Find out how its limitless possibilities affect not only tech giants but also today's manufacturers.

English
17
Sep 2018

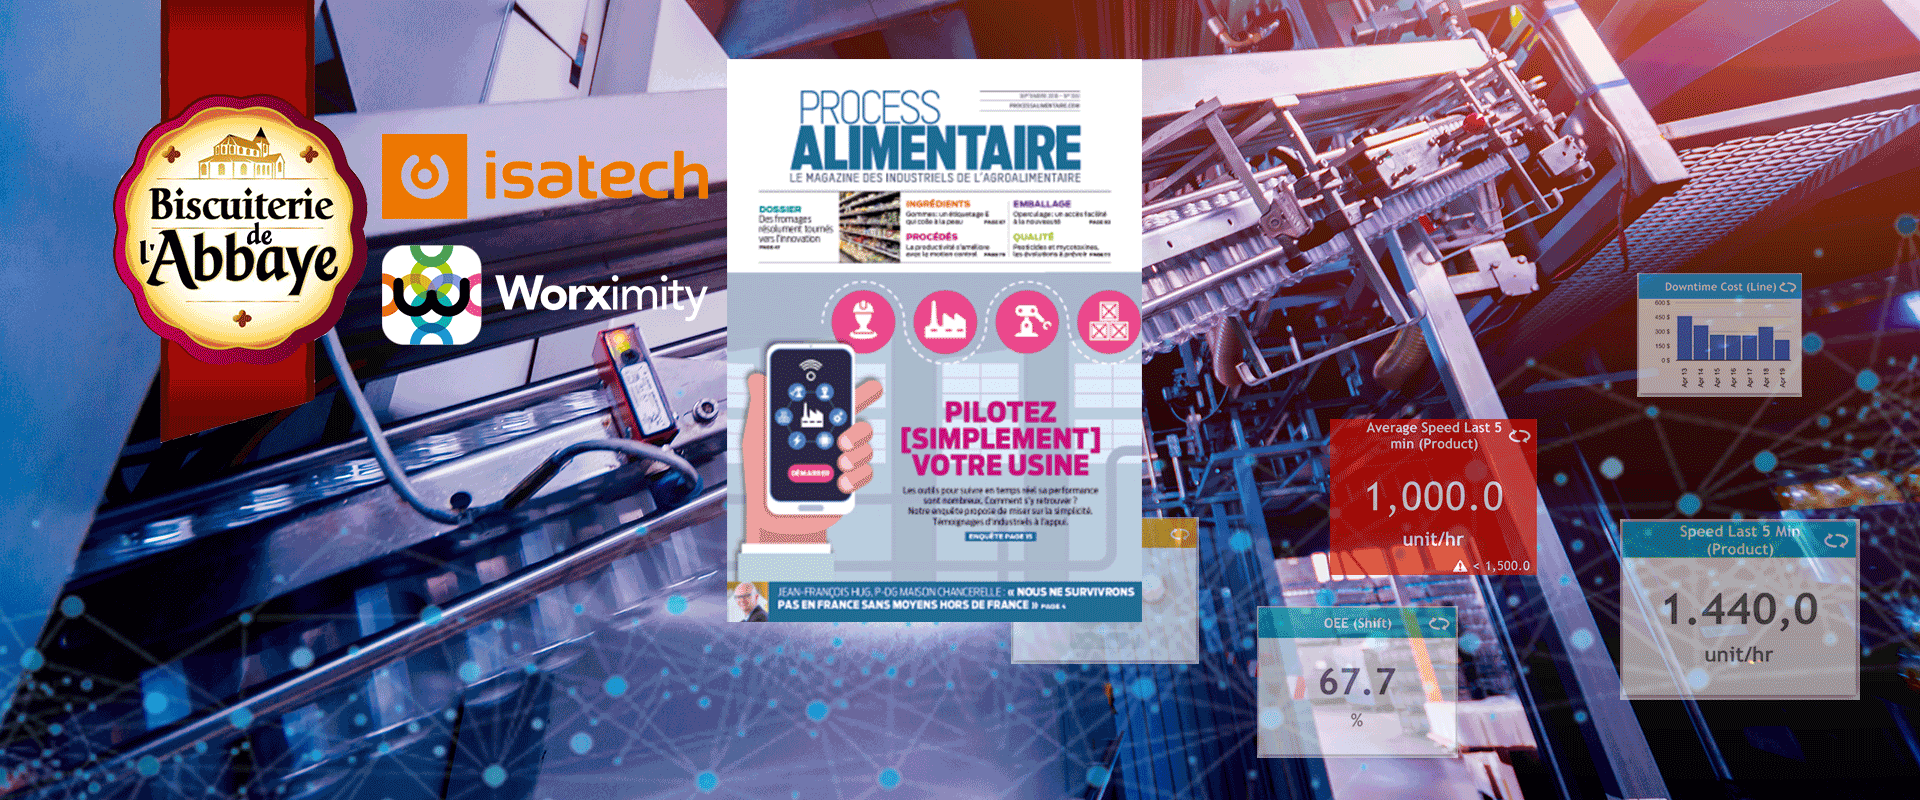
Worximity in French magazine Process Alimentaire with its customer Biscuiterie de l'Abbaye

Worximity and its partner Isatech are featured in the French magazine Process Alimentaire, which covers the TileConnect and TileBoard smart factory technologies and their integration with the Microsoft Dynamics 365 Navision ERP to improve OEE by 5%.

English
29
Mar 2019

A New Case Study!

Download our new case study to learn more about Industry 4.0 and become an innovative manufacturer yourself!

English