5/6/18

Visualize the uses of AI and analytics with this interactive tool

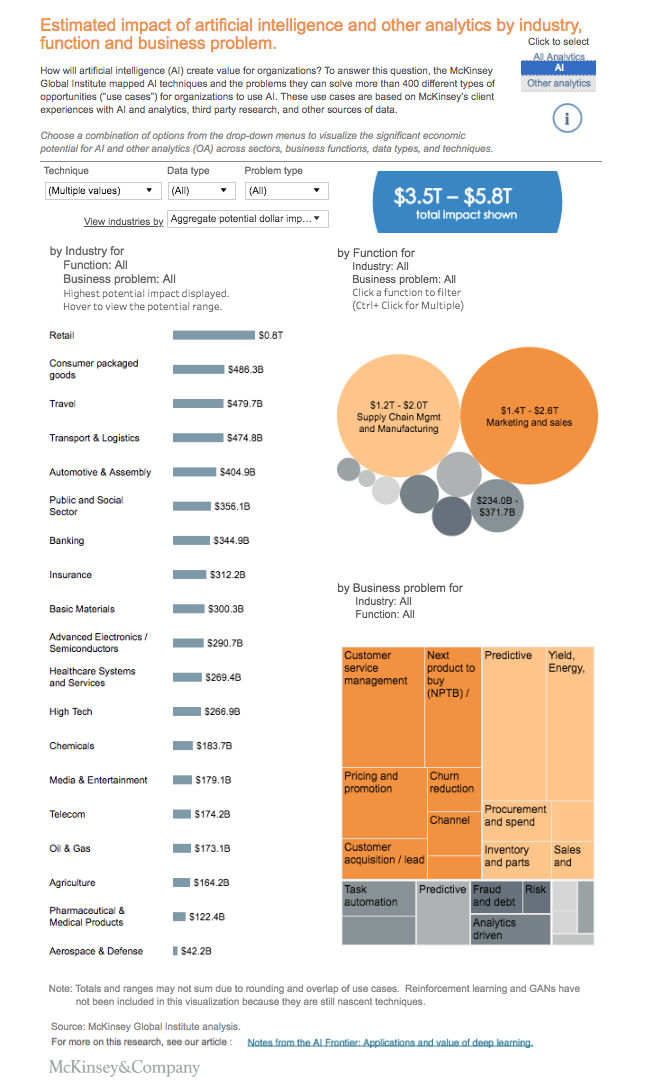
McKinsey's interactive data visualization shows the potential value created by artificial intelligence and other analytics techniques for 19 industries and nine business functions.

Artificial Intelligence
Visualize the uses of AI and analytics with this interactive tool

McKinsey published this interactive tool to help people understand the uses and impacts of artificial intelligence and analytics.  It is based on a study of more than 400 use cases, covering 19 industries and nine business functions.

Play with the Technique, Data Type and Problem Type to visualize the impact.
McKinsey_Visualization_tool

SOURCE: https://www.mckinsey.com/featured-insights/artificial-intelligence/visualizing-the-uses-and-potential-impact-of-ai-and-other-analytics


Want to learn more?
Download the ebook
Related blog articles

Related articles

Back to the blog
Thank you! Your submission has been received!
Oops! Something went wrong while submitting the form.
9
May 2019

Will You Be Able to Catch Up to Industry Leaders? - Part 1

English
13
Aug 2018

What are the Top AI Trends of 2018?

English
19
Jun 2019

5 First Steps Towards Artificial Intelligence

English

Related articles

Back to the blog
Thank you! Your submission has been received!
Oops! Something went wrong while submitting the form.
13
Apr 2018

Measuring Lean in the Food Manufacturing Industry

Learn how the food industry can implement lean manufacturing methods to maximize efficiency.

English
13
Apr 2018

Poka-Yoke Methods in Lean Manufacturing

In lean manufacturing, Poka-yoke device is anything that prevents an error within the manufacturing process or makes defects easily detectable, a vital component in adhering to lean manufacturing.

English
12
Oct 2020

Tips to Minimize Types of Waste with Lean Manufacturing

Read about the 8 deadly wastes and lean manufacturing principles you need to implement at your factory.

English