5/6/18

Visualize the uses of AI and analytics with this interactive tool

McKinsey's interactive data visualization shows the potential value created by artificial intelligence and other analytics techniques for 19 industries and nine business functions.

Artificial Intelligence
Visualize the uses of AI and analytics with this interactive tool

Related articles

Back to the blog
Thank you! Your submission has been received!
Oops! Something went wrong while submitting the form.
15
Feb 2018

Harvard Business Review Article on Artificial Intelligence

English
15
Mar 2018

Some Artificial Intelligence Statistics, by Sector

English
23
Jan 2019

Food Industry: True Opportunities Reside in Artificial Intelligence

English

Related articles

Back to the blog
Thank you! Your submission has been received!
Oops! Something went wrong while submitting the form.
24
Oct 2017

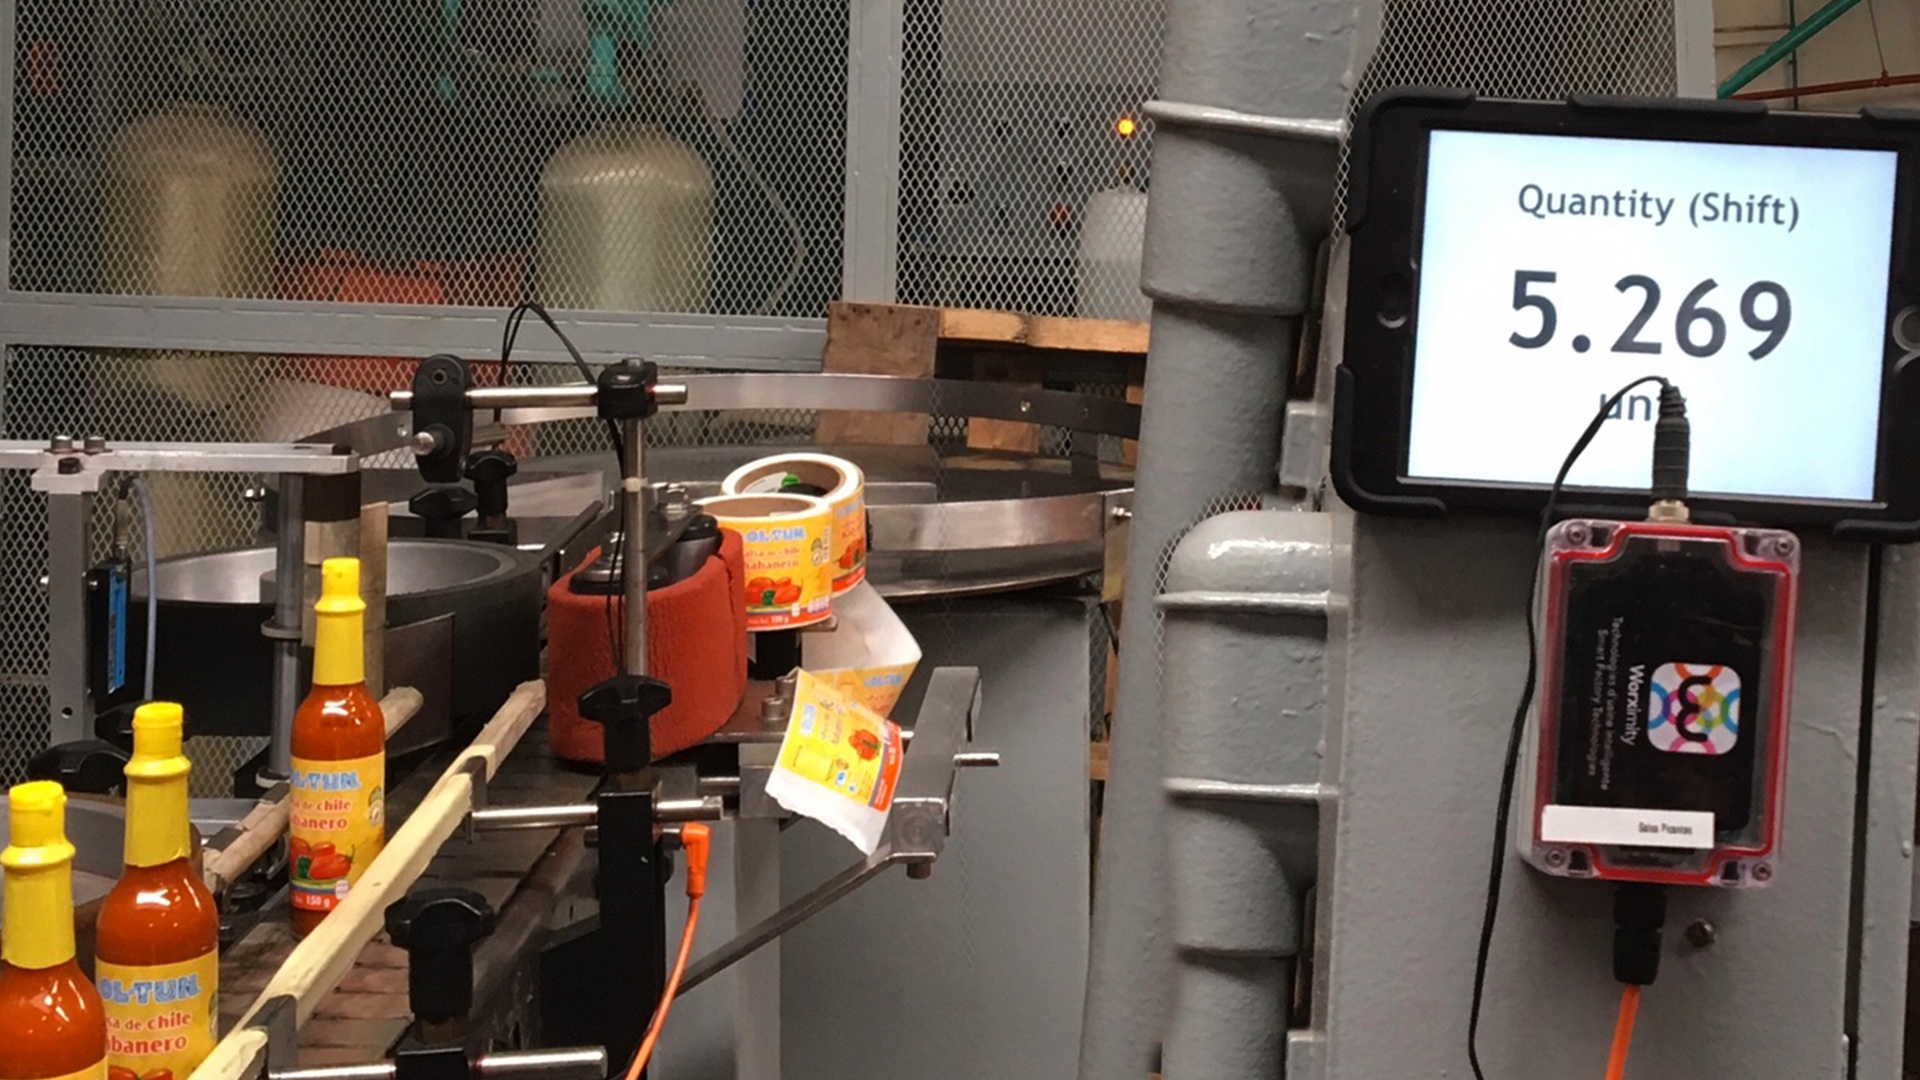
How LOL TUN Improved Its Uptime by 20%

Since LOL TUN started using TileBoard, managers have seen productivity improve by more than 10%.

English
28
May 2018

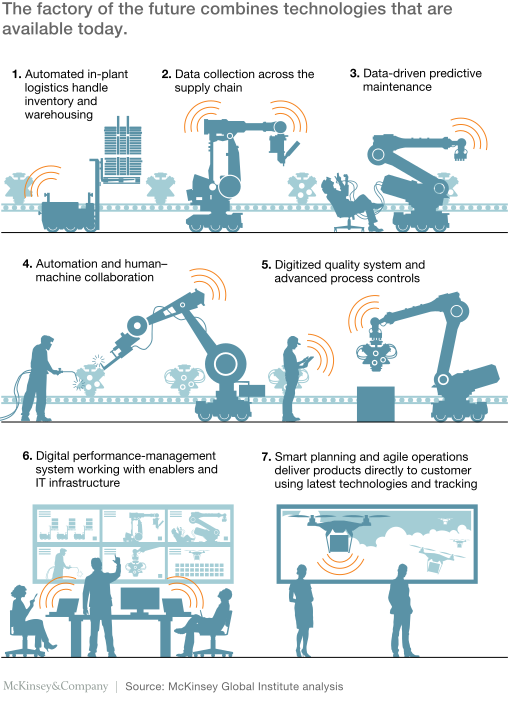
The Smart Factory of the Future by McKinsey

McKinsey presents the technologies available today in a smart factory: automated data collection, digitized quality system, smart planning and agile operations

English
29
Mar 2021

Top Benefits of Connecting Your Packaging Lines for Production Line Data Collection

Connecting your packaging lines for your production line data collection can help improve your overall throughput.

English