5/6/18

Visualize the uses of AI and analytics with this interactive tool

McKinsey's interactive data visualization shows the potential value created by artificial intelligence and other analytics techniques for 19 industries and nine business functions.

Artificial Intelligence
Visualize the uses of AI and analytics with this interactive tool

Related articles

Back to the blog
Thank you! Your submission has been received!
Oops! Something went wrong while submitting the form.
15
Jan 2019

Robots and Artificial Intelligence Taking Over the Food Industry

English
30
May 2018

How to Get Started as a Developer in AI

English
6
Dec 2018

AI in Baking for Real-Time Predictions

English

Related articles

Back to the blog
Thank you! Your submission has been received!
Oops! Something went wrong while submitting the form.
12
Apr 2018

Machine Monitoring: How Competitive Factories Decide Better

This post explores how valuable the data is that’s gathered in production via machine monitoring, and how cross-functional teams can collaborate better when the data is shared.

English
19
Feb 2018

Machine Monitoring: What is the Cost of Your Downtime?

Find out how much your downtime, both planned and unplanned, is really costing you -- and what you can do about it.

English
8
Feb 2018

OEE & Thermoforming: Using Real-Time Dashboard is Key

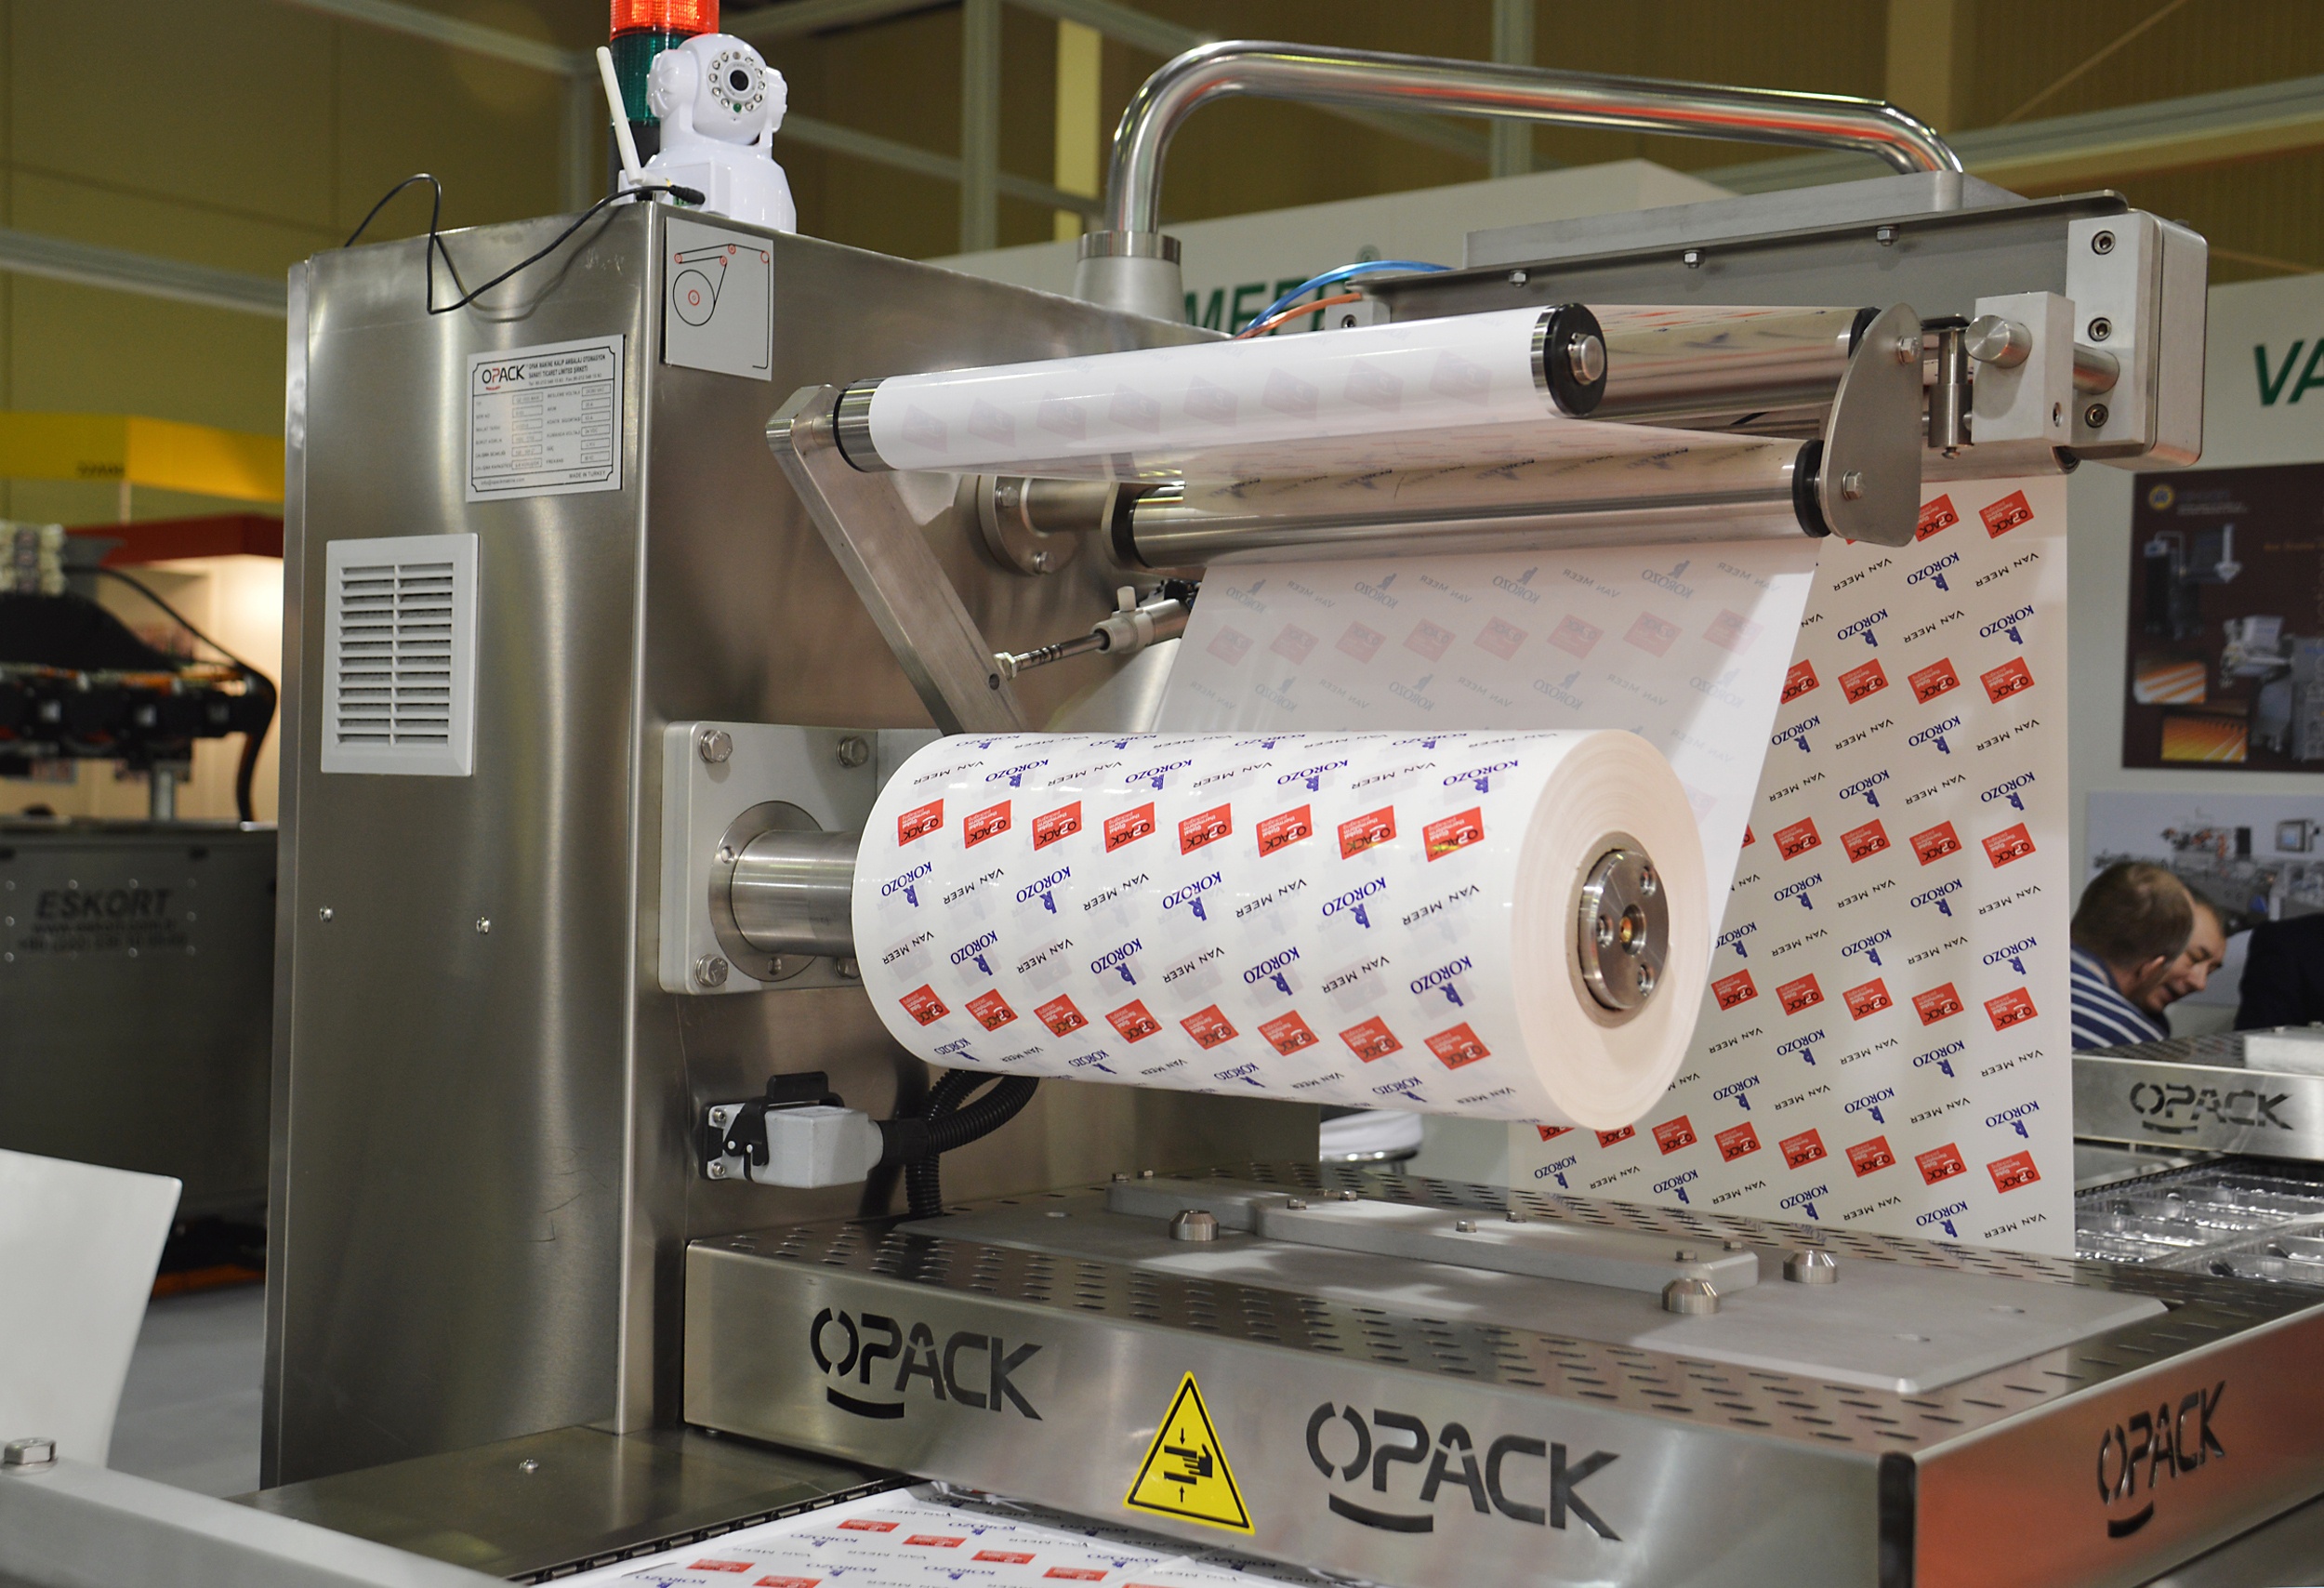
How can you gage OEE in thermoforming processes? Thermoforming processes are performed by specialized equipment, outputting high value packaging and generally involve running costs such as adapted polymer films, packaging gas and custom made, package forming molds.

English