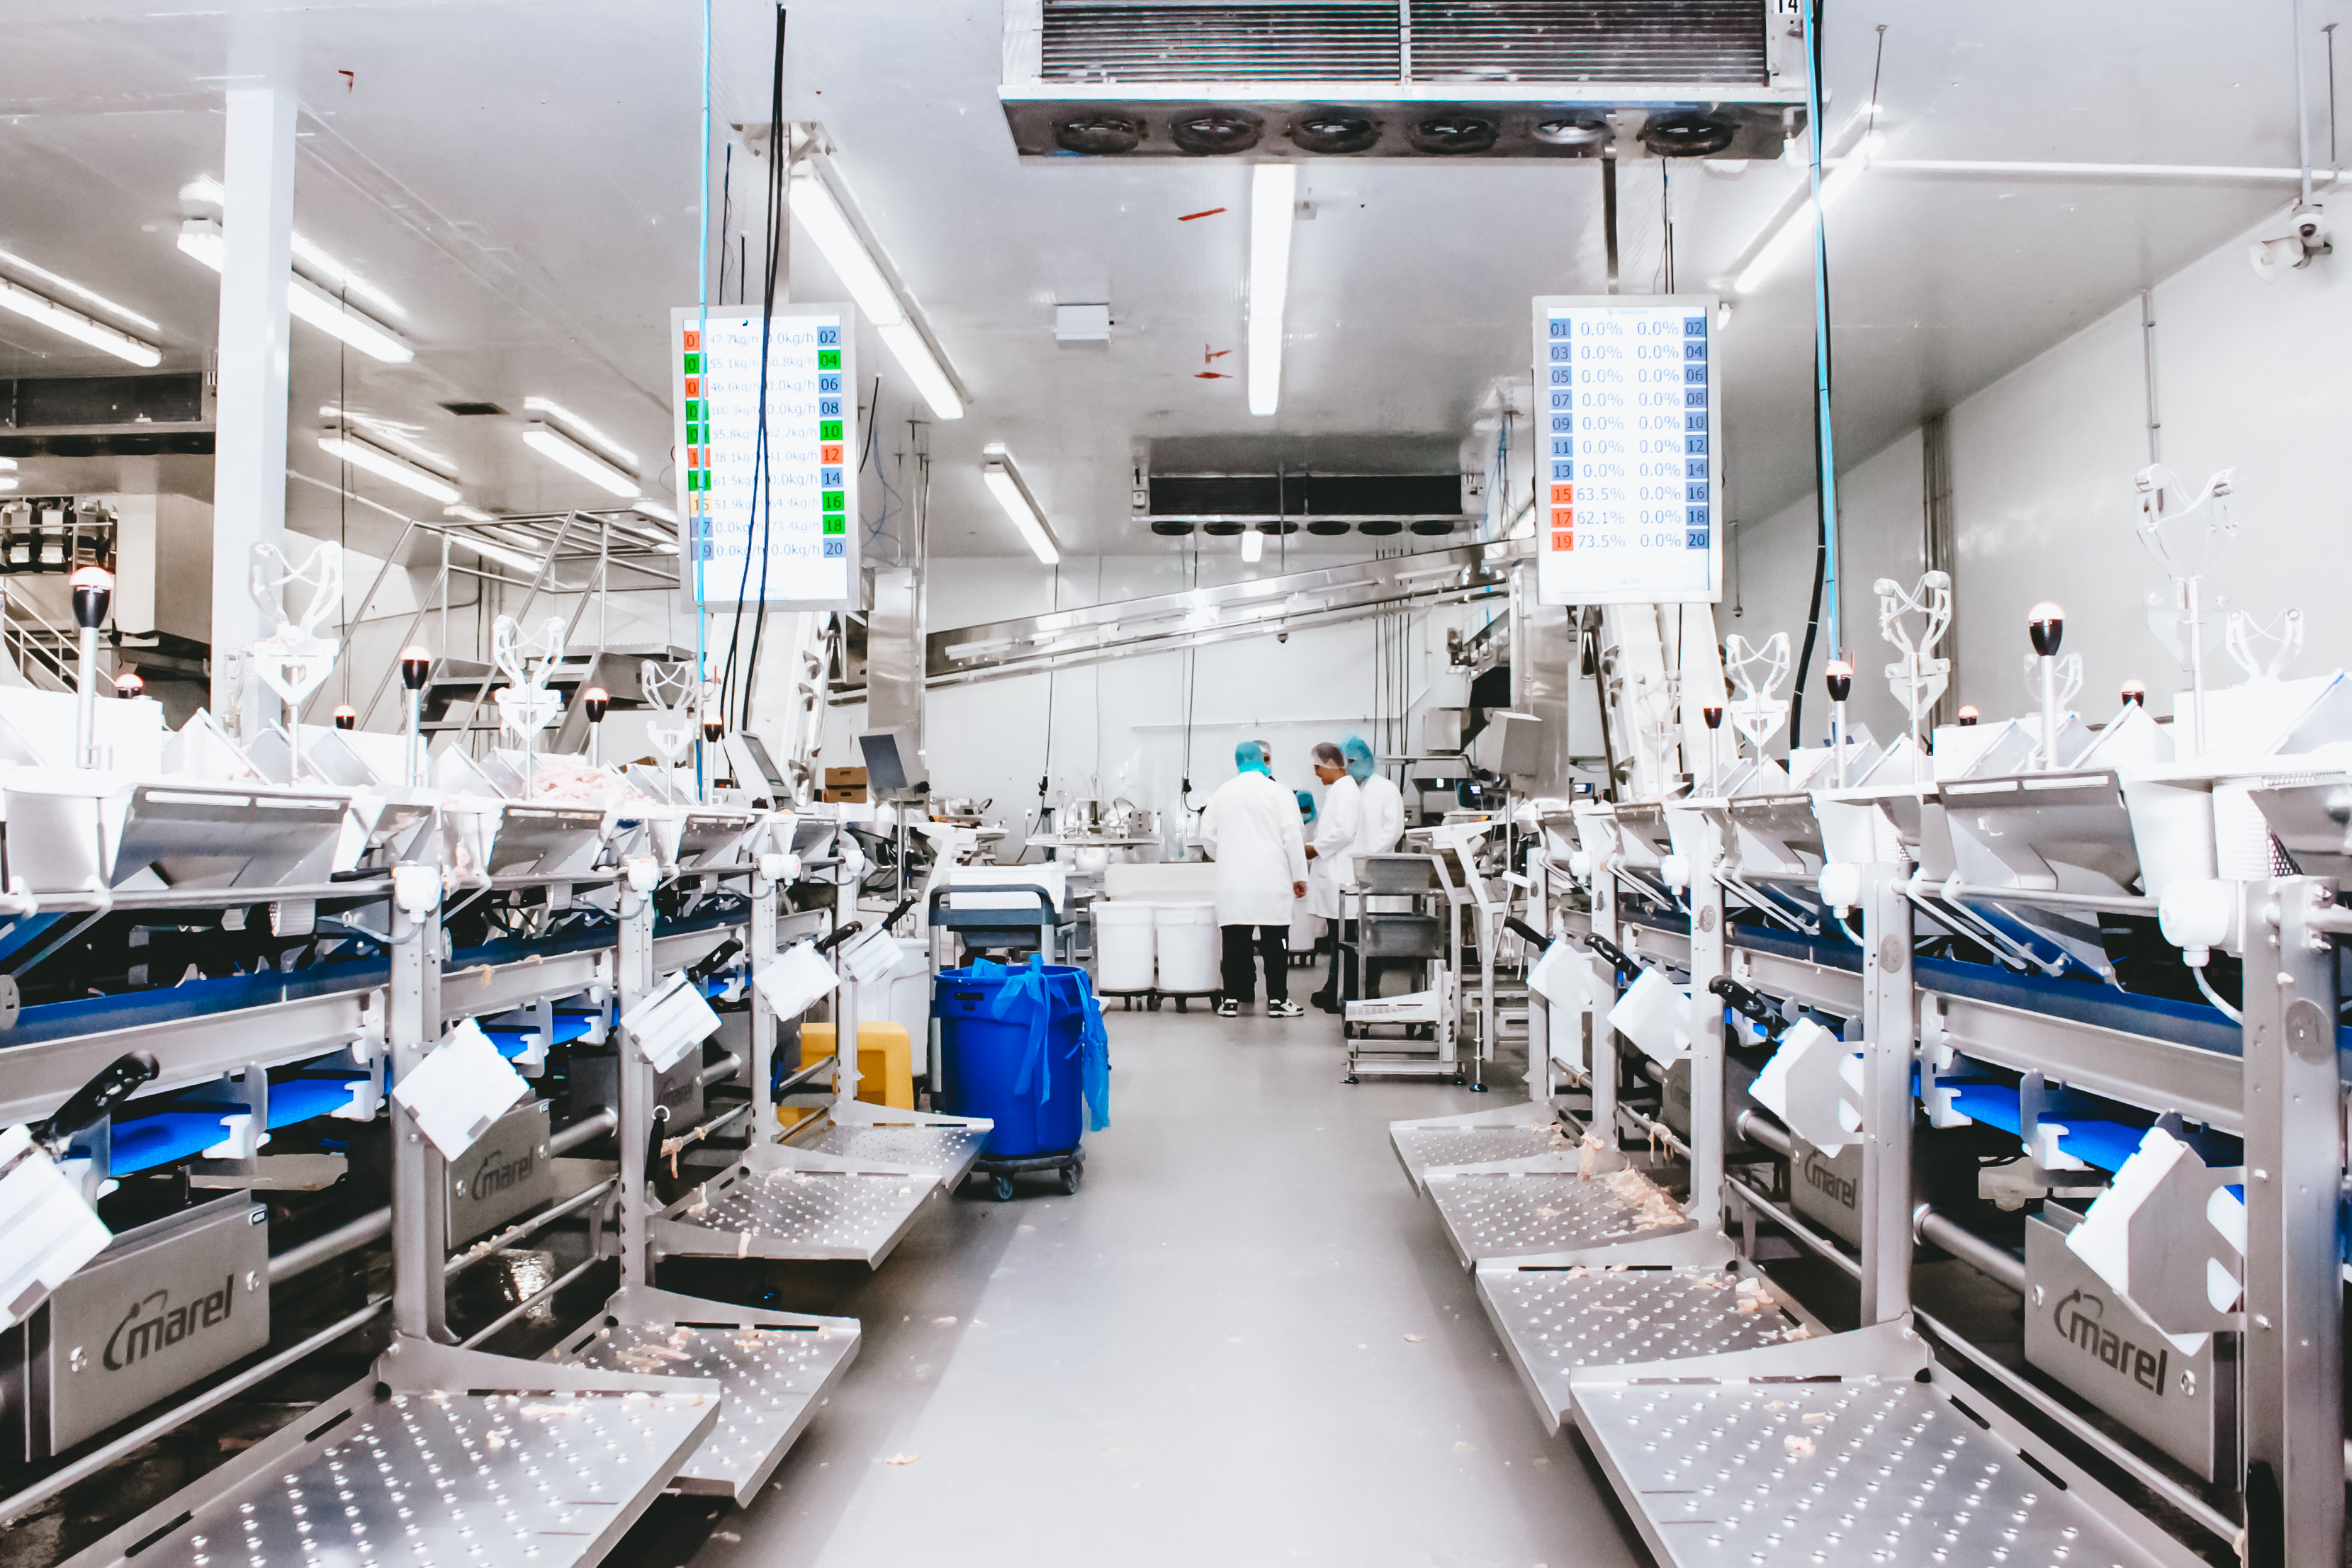

Each day, your facility manufactures countless units of food for distribution around the country—or around the world. In addition to the products themselves, you need to be aware of the status of workers, machine productivity and effectiveness, and more. It’s a difficult job, but luckily, technology can help.
At Worximity, we provide real-time dashboards customized to the data points you need to focus on to maximize your food processing factory operations. Read on to learn how dashboard data can help, and see two of our most popular dashboards in action.
Benefits of a Real-Time Dashboard
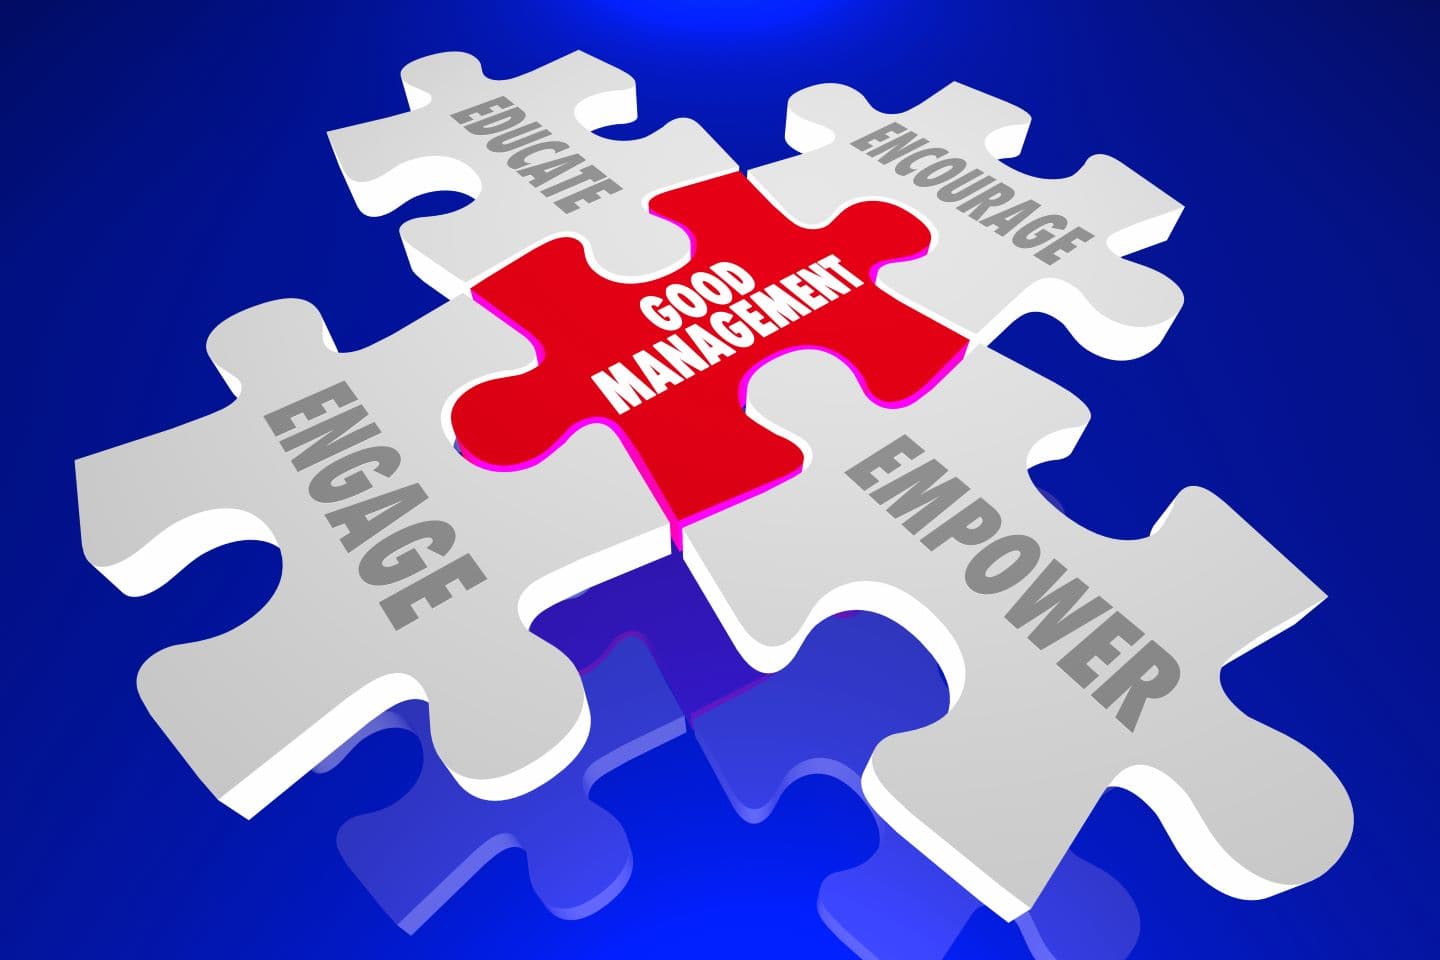
Using real-time dashboards in your food processing factory operations empowers you and your team to see and respond to risks and opportunities as they arise and work toward concrete goals. The information captured on screen informs how you pivot to enhance productivity.
Thanks to real-time dashboards, you can:
Visualize food production factory KPIs.
Your team can respond to issues faster by seeing critical KPIs like efficiency or production rate on screen throughout your factory during each shift.
Set up alerts easily.
If you know you’ll need to keep your eyes on a particular function, establish KPI alerts centered on particular triggers, such as deadlines or time.
Improve access to information.
Actionable real-time data on your dashboards reveals current performance metrics, so your team can focus on the pieces that matter most. Because the dashboards are readily available, decision makers get the information they need, too.
Dashboards in Action
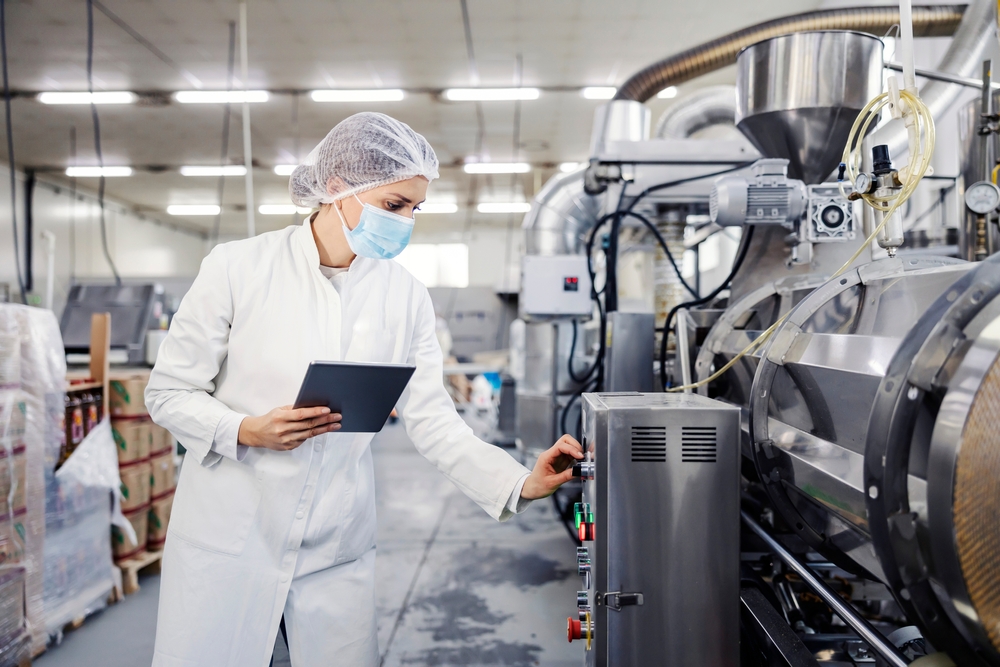
Operations managers oversee the operational performance of their food processing factory, from the facility itself to equipment and employees. Tilelytics technology utilizes real time customizable dashboards, helping managers identify production trends, patterns, and opportunities allowing for more informed decisions. With this analytical information at hand, operations can continuously improve their efficiency and gain a competitive advantage. Tilelytics dashboards pull information from food processing machinery in various configurations. Let’s look at a few options.
Availability and Downtime Dashboard
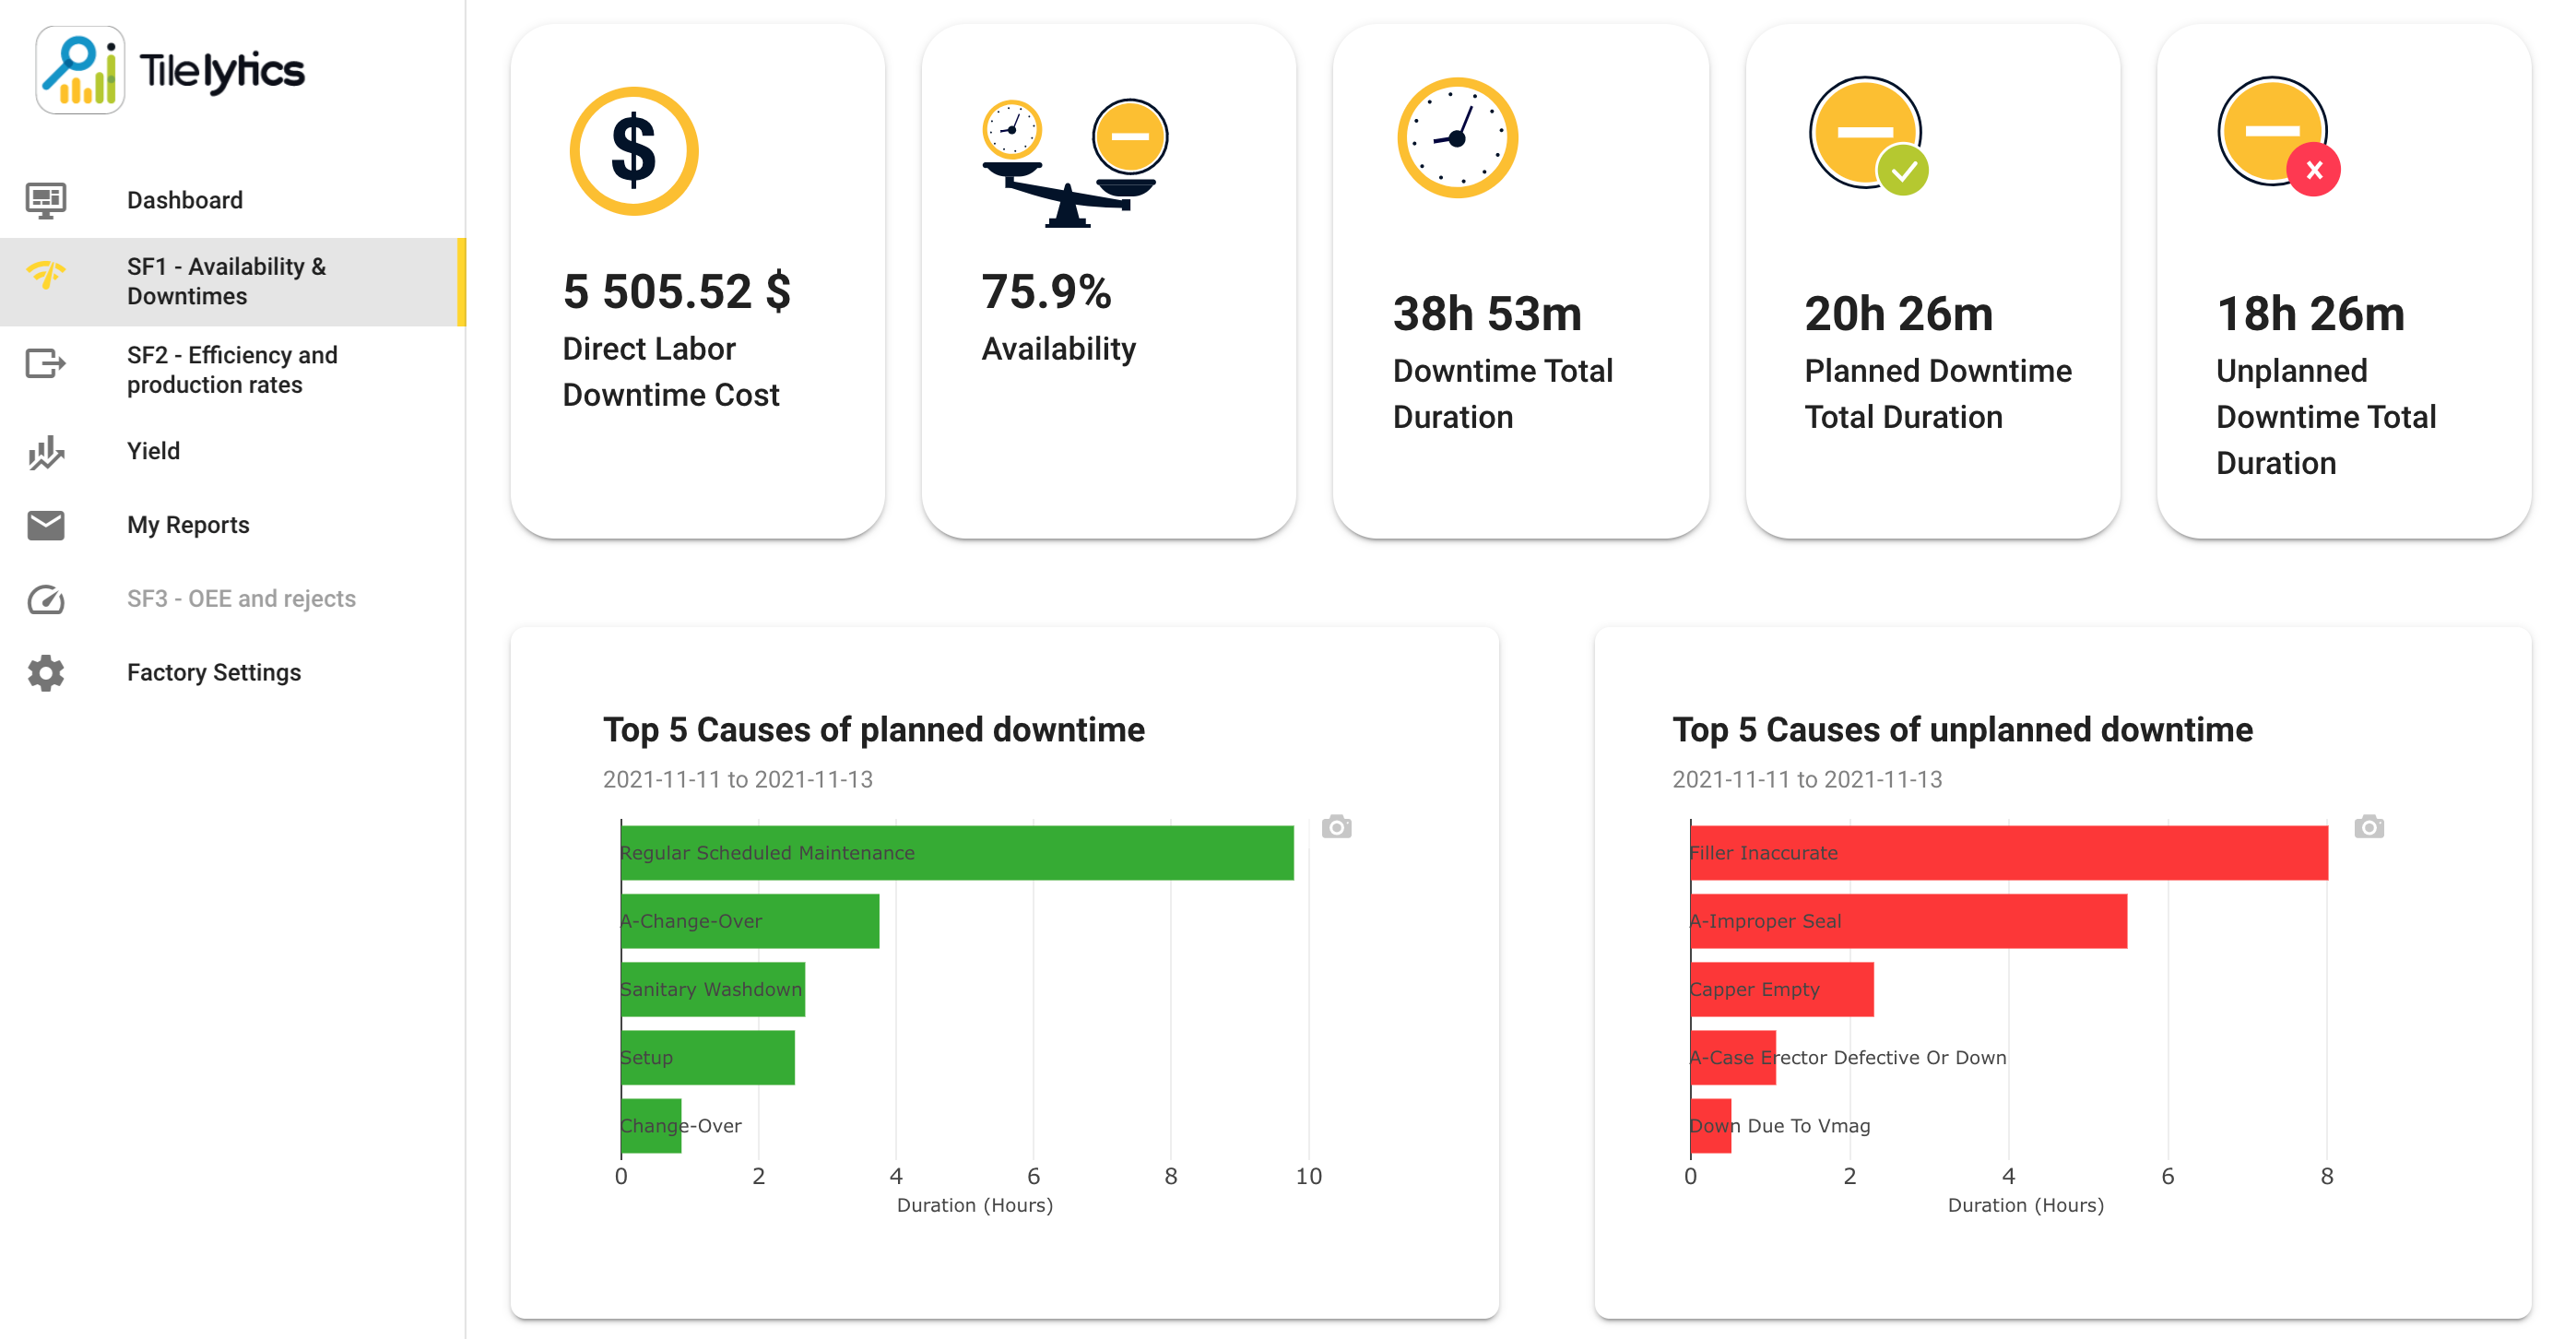
Tilelytics’ Availability and Downtime Dashboard is built with managers in mind. It distills information about your food production factory’s operations—by minutes, hours, and percentages.
Downtime Assessment
With the Availability and Downtime Dashboard, floor supervisors get insights about downtime. The dashboard data breaks down labor costs during downtime, percentage of machine availability, and downtime duration—total, planned, and unplanned.
One of the Availability and Downtime Dashboard’s convenient features for managers is that it spotlights the top five causes of both planned and unplanned downtime, eliminating guesswork about why operations have stalled. This helps managers determine whether problems are caused by man or machinery, which can inform staffing changes and machinery upgrade plans. Managers can then assess whether their benchmarks are still attainable or if they need to make structural changes to reduce downtime.
OEE Dashboard
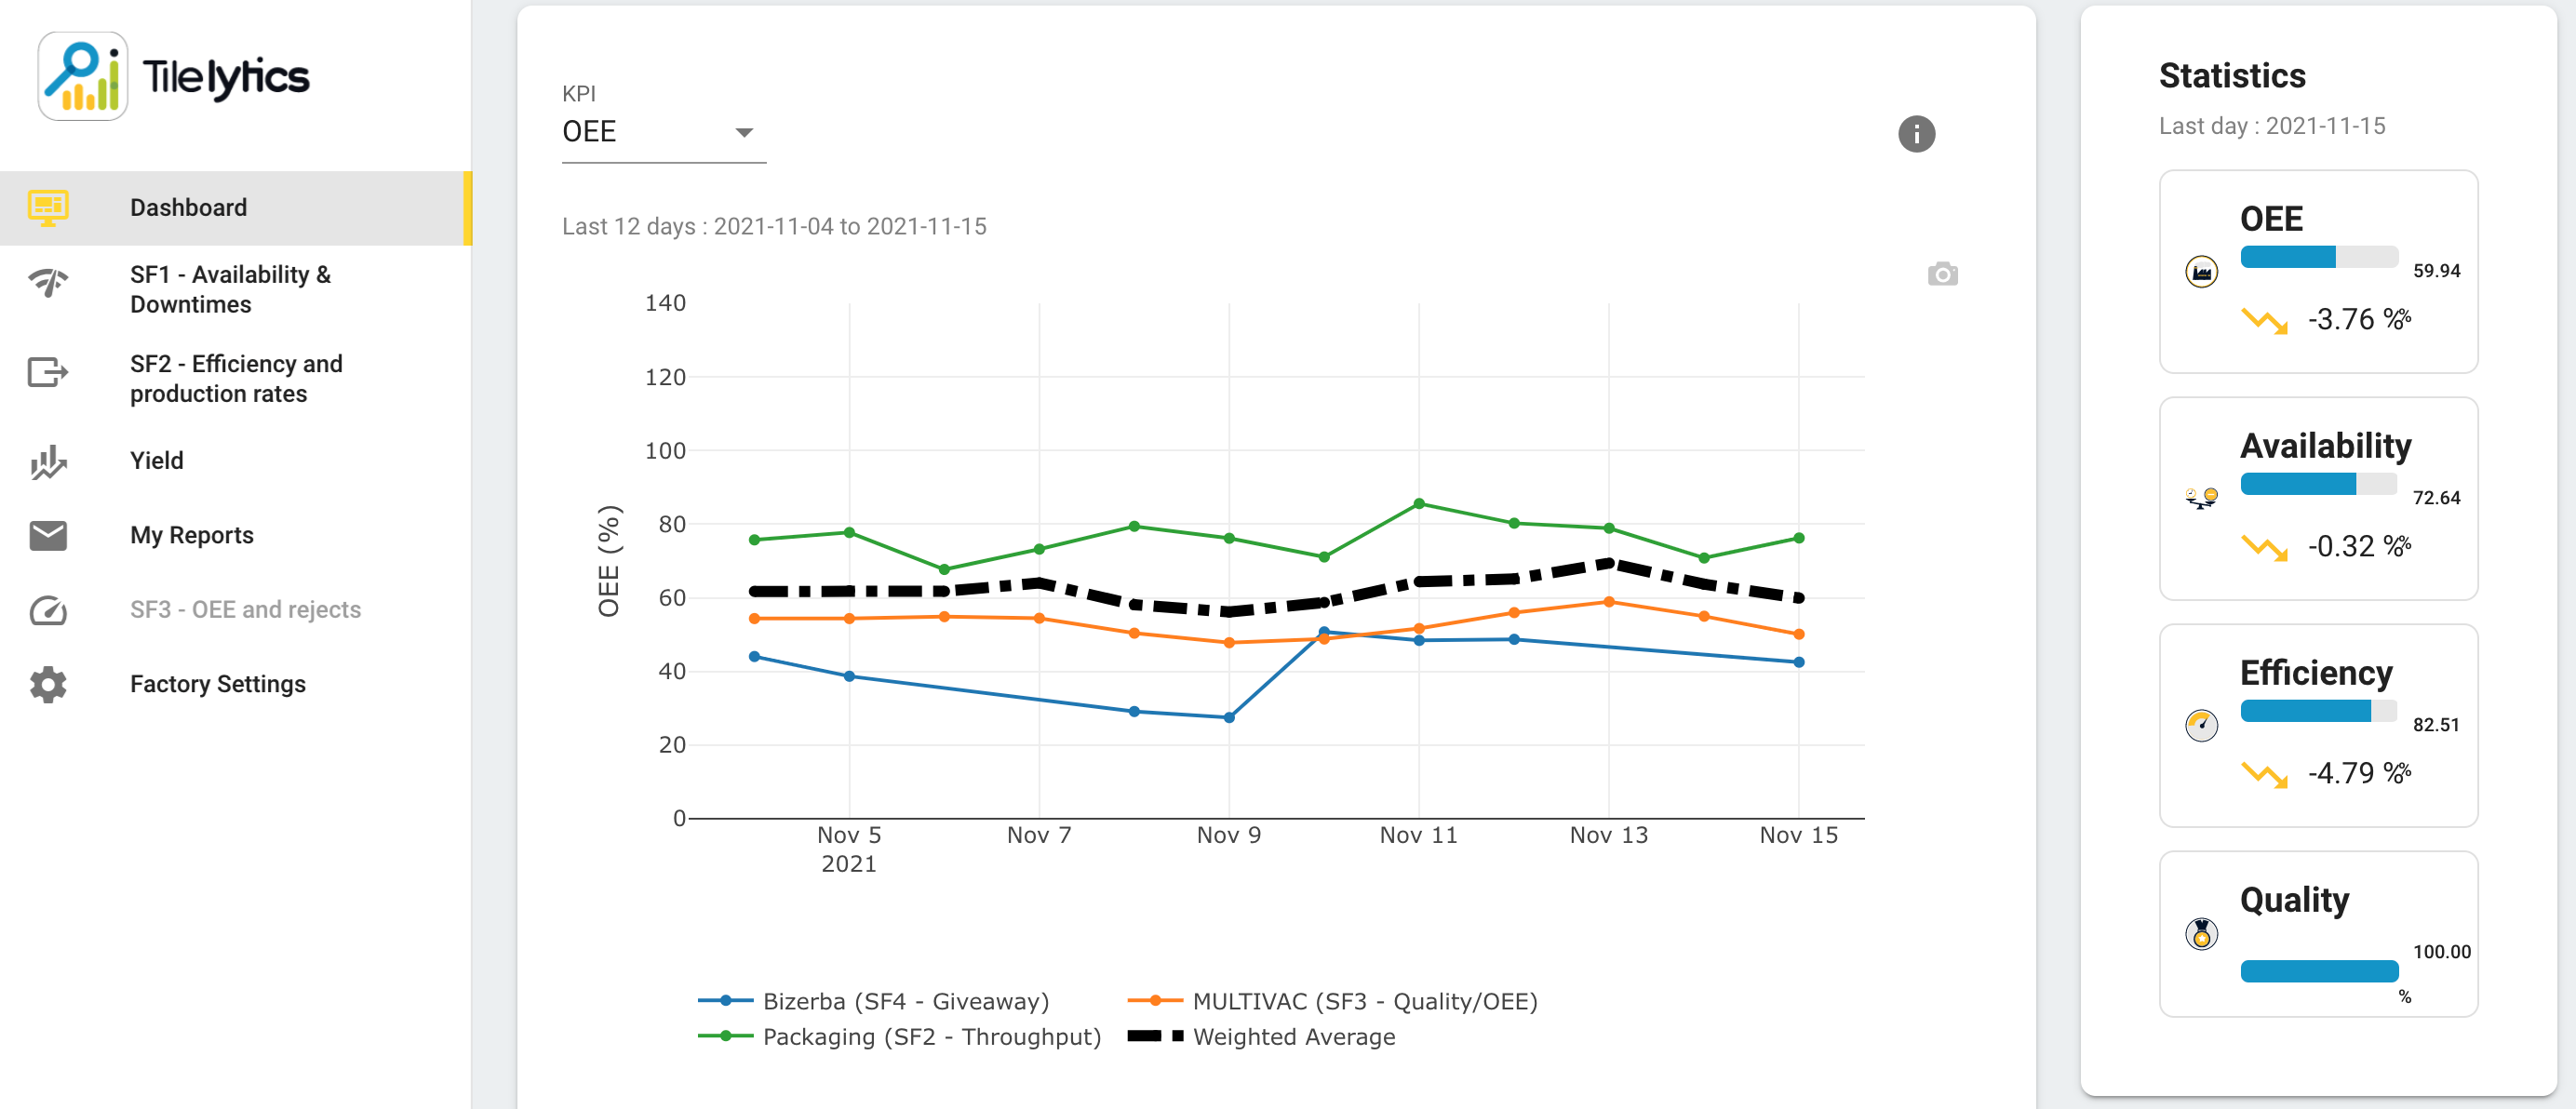
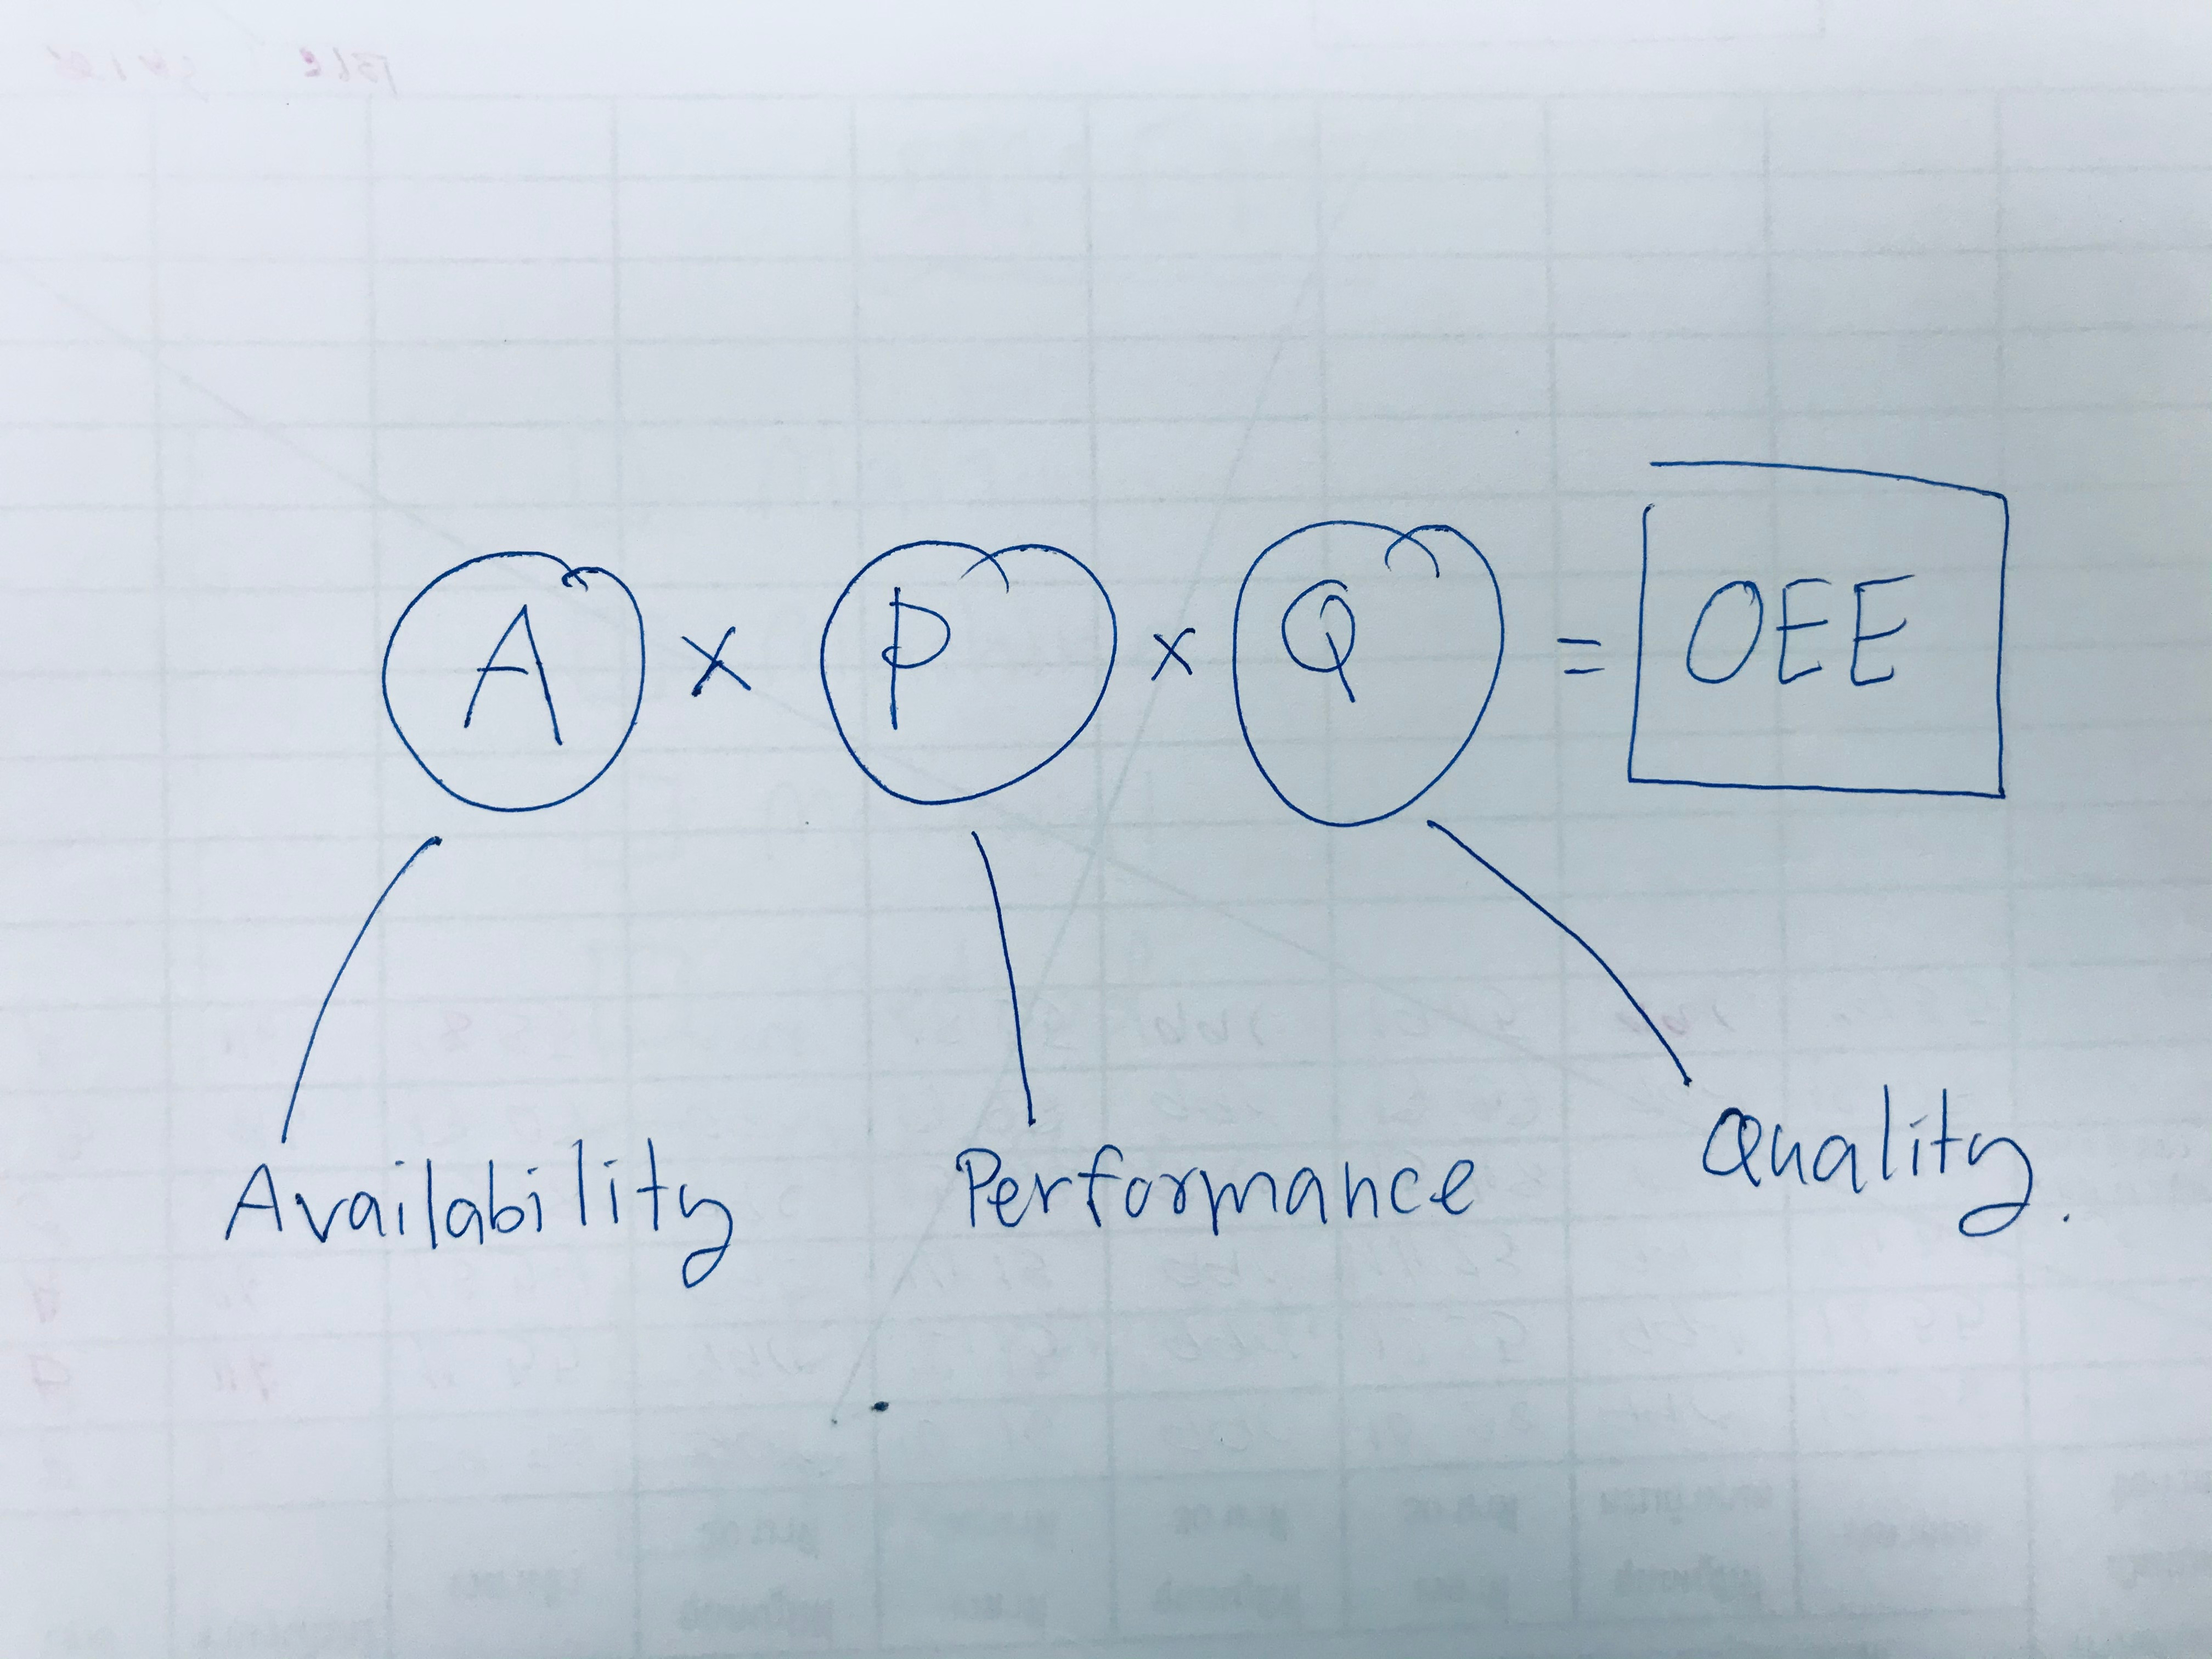
Tilelytics’ OEE Dashboard keeps managers tuned into machine productivity metrics. The OEE Dashboard provides data on overall equipment effectiveness (OEE), revealing how efficient your food production factory equipment is.
OEE Data in One Place
The OEE Dashboard shows availability, efficiency, and quality, plus overall OEE score. Availability plays heavily into OEE, and downtime happens frequently because equipment is rendered unavailable because of maintenance or malfunctions. The OEE Dashboard reveals machine availability percentage and effectiveness, helping to plan for new processes, maintenance steps, or new machinery. If there’s a bottleneck in the system, the OEE Dashboard will highlight the metric(s) that are most affected.
Start Using Dashboards in Your Food Production Facility
As a supervisor, you need to know what’s happening in each area of your operations, whether that means being aware of downtime causes or changing course to staff appropriate functions. It’s impossible to be everywhere at once—but real-time dashboards within the Worximity Tilelytics platform can help. If you’re ready for a change, contact us today for your demo and start transforming your factory.