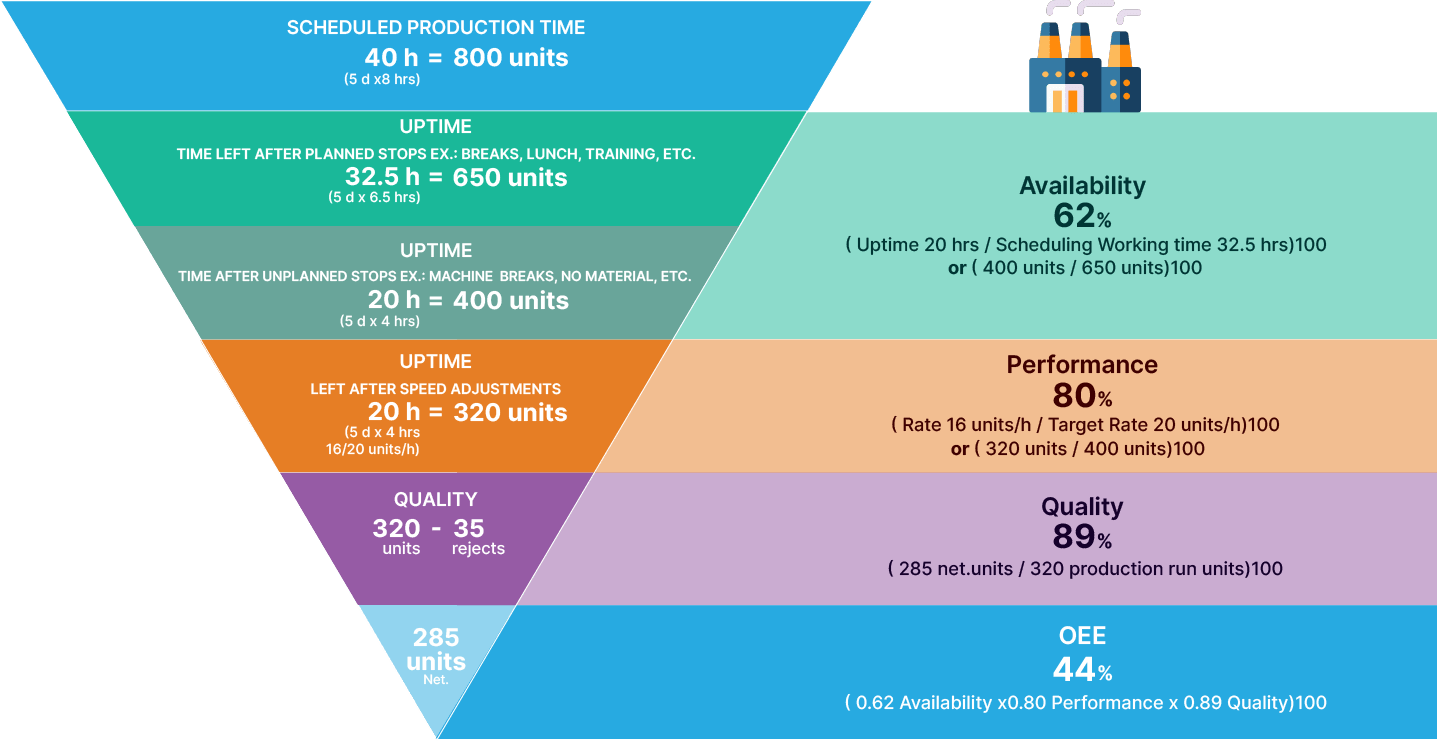
Measuring equipment availability reveals the percentage of time that machines and processes actually run and are available for production versus what is planned. This availability is referred to as uptime, and it’s an important metric for factories to not just measure but also refine.
Availability loss encompasses anything that impedes planned production for a specified time period. Common types of availability loss include unplanned equipment maintenance, longer changeovers, and material shortages. For factories, availability loss is part of the overall equipment effectiveness (OEE) manufacturing metric, along with speed loss and quality loss.
Using Availability Loss as an OEE Value
Measuring availability loss is crucial, but availability is just one of the three values that OEE measures.
OEE measures three components:
- Availability—actual operating time versus planned production time
- Efficiency—ideal cycle time versus actual operating time
- Quality—planned good pieces versus actual good pieces
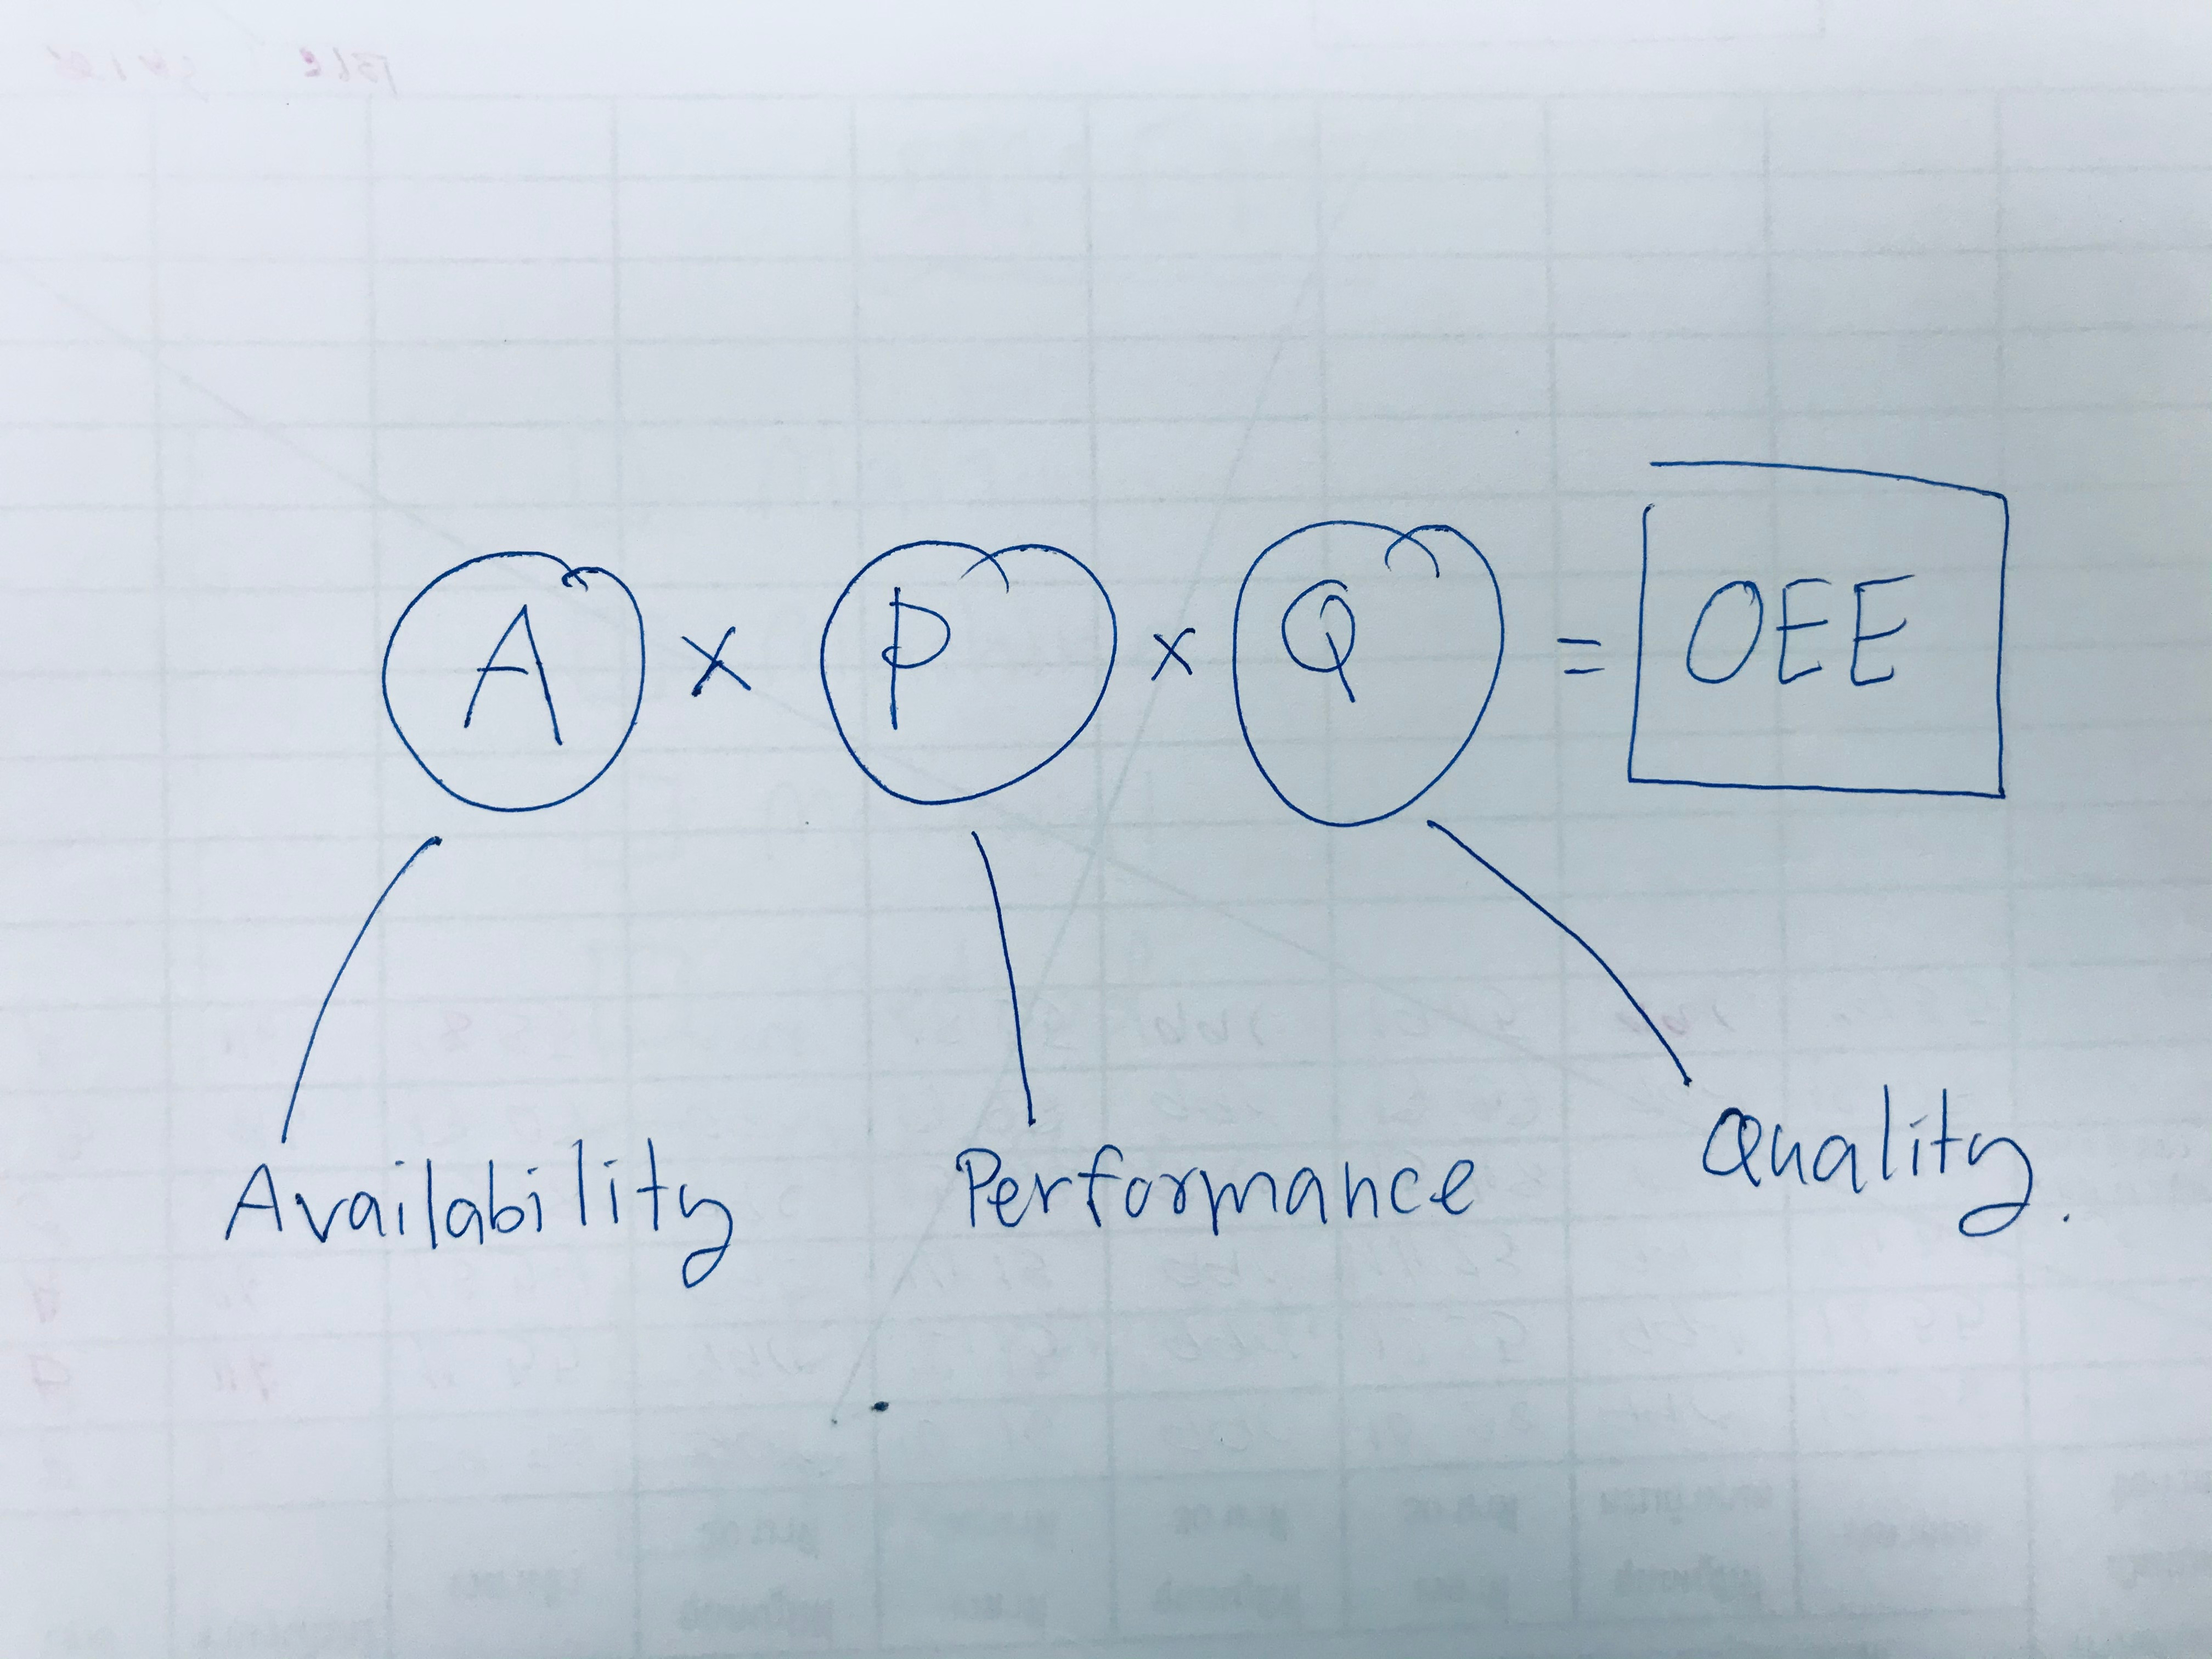
OEE formula:
- OEE = availability x efficiency x quality
When a factory has production line values for each of these components, it can calculate OEE by multiplying the three components to determine an overall value.
Availability is an important OEE value. Events that create loss of availability include everything from unplanned equipment failures to planned stops such as changeover time.
Let’s take a look at two ways to improve availability loss and OEE.
1. Measure, Benchmark, and Identify Opportunities
Measuring OEE to get benchmark data can reveal valuable information about your factory’s true availability. Managers find that changeover time is a common improvement area when it comes to equipment availability loss.
Though changeovers are included in the OEE analysis as a planned stop—and it is almost impossible for most factories to eliminate manual changeover times—measuring actual changeover time versus planned changeover time could reveal that processes aren’t happening as quickly as they should. It could be as simple as someone realizing that two changeover steps could be combined into one, saving minutes that add up quickly.
Let’s look at a cut-and-dried example. Say your factory is going through 40 changeovers a day with planned downtime of 20 minutes for each changeover. That’s a total of 800 minutes—or nearly 13 hours—of planned downtime.
However, when you perform an OEE analysis, you can clearly see that manual production line changeovers are inconsistent and not within the planned downtime—and you can also clearly see how these changeovers can be improved.
2. Identify, Prioritize, and Strategize
Once you have the data you need, it’s time to take action. First, identify all time-saving opportunities, from human to machine performance. Using lean manufacturing’s single-minute exchange of die (SMED) system can help seriously reduce changeover time. The SMED systems convert as many changeovers as possible to be performed while the equipment is still running, and then simplify remaining steps.
Going back to our example of the 20-minute changeovers, let’s say that an OEE analysis reveals a time-saving measure that could reduce changeover time to 10 minutes. Often, the opportunity to reduce planned downtime is relatively simple or more obvious than you imagined.
It could be that the operators performing manual changeovers are inconsistent with their timing or that different shifts have different ways of doing changeovers. When you identify one streamlined way of performing the changeover, you can save valuable minutes or even hours of downtime each day.
Show Value: Availability Loss Data’s Direct Impact on Fixed Costs
By measuring OEE to set benchmarks, factories frequently realize they haven’t been hitting their set planned downtime parameters—but they also discover new ways to reduce downtime. For example, because of the visibility and data discoveries, you can reduce steps by planning a better product order and create more efficient task distribution among operators.
These efficiencies reduce downtime—saving costs—and these wins should be communicated to the decision makers. That’s why these results from OEE efforts are so crucial. Once you redefine availability and quantify the cost-saving opportunities, you take the OEE results to the financial decision makers and show them the direct impact on fixed costs. By analyzing your OEE, you find ways to continually improve your OEE.
Use Digital Technology to Determine OEE and Improve Availability Loss
These days, digital technology provides us with comprehensive and precise ways to measure OEE. With digital tools like Worximity’s Smart Factory analytics software, manufacturers are better equipped to get the most accurate data about factory performance. Using digital sensors, Wi-Fi, and a real-time dashboard, managers can monitor accurate factory performance, making continuous improvement efforts more meaningful.
Start with an OEE analysis. Give our OEE calculator a try and take the first steps toward maximizing your availability rate.