Malgré l'ajout d'emplois et l'avènement de la transformation numérique dans le secteur manufacturier, il existe une réalité incontournable: la productivité reste étonnamment faible. Selon l'Information Technology & Innovation Foundation, l'économie américaine a ajouté 830 000 emplois manufacturiers, mais la productivité (mesurée en production réelle par heure de travail) dans ce secteur a connu une baisse constante.
Avec l'essor de l'Industrie 4.0, de l'Internet industriel des objets (IIoT) et des usines intelligentes, les gens pourraient s'attendre à ce que la productivité manufacturière monte en flèche. Et s'il est vrai que l'adoption a augmenté parmi les grandes entreprises manufacturières, la recherche indique que les entreprises manufacturières de petite et moyenne taille ont encore du chemin à parcourir pour adopter ces technologies. Cet écart met en évidence la nécessité de combler le fossé et de s'assurer que toutes les entreprises manufacturières comprennent parfaitement les différentes options qui s'offrent à elles et les avantages qu'elles peuvent en retirer.
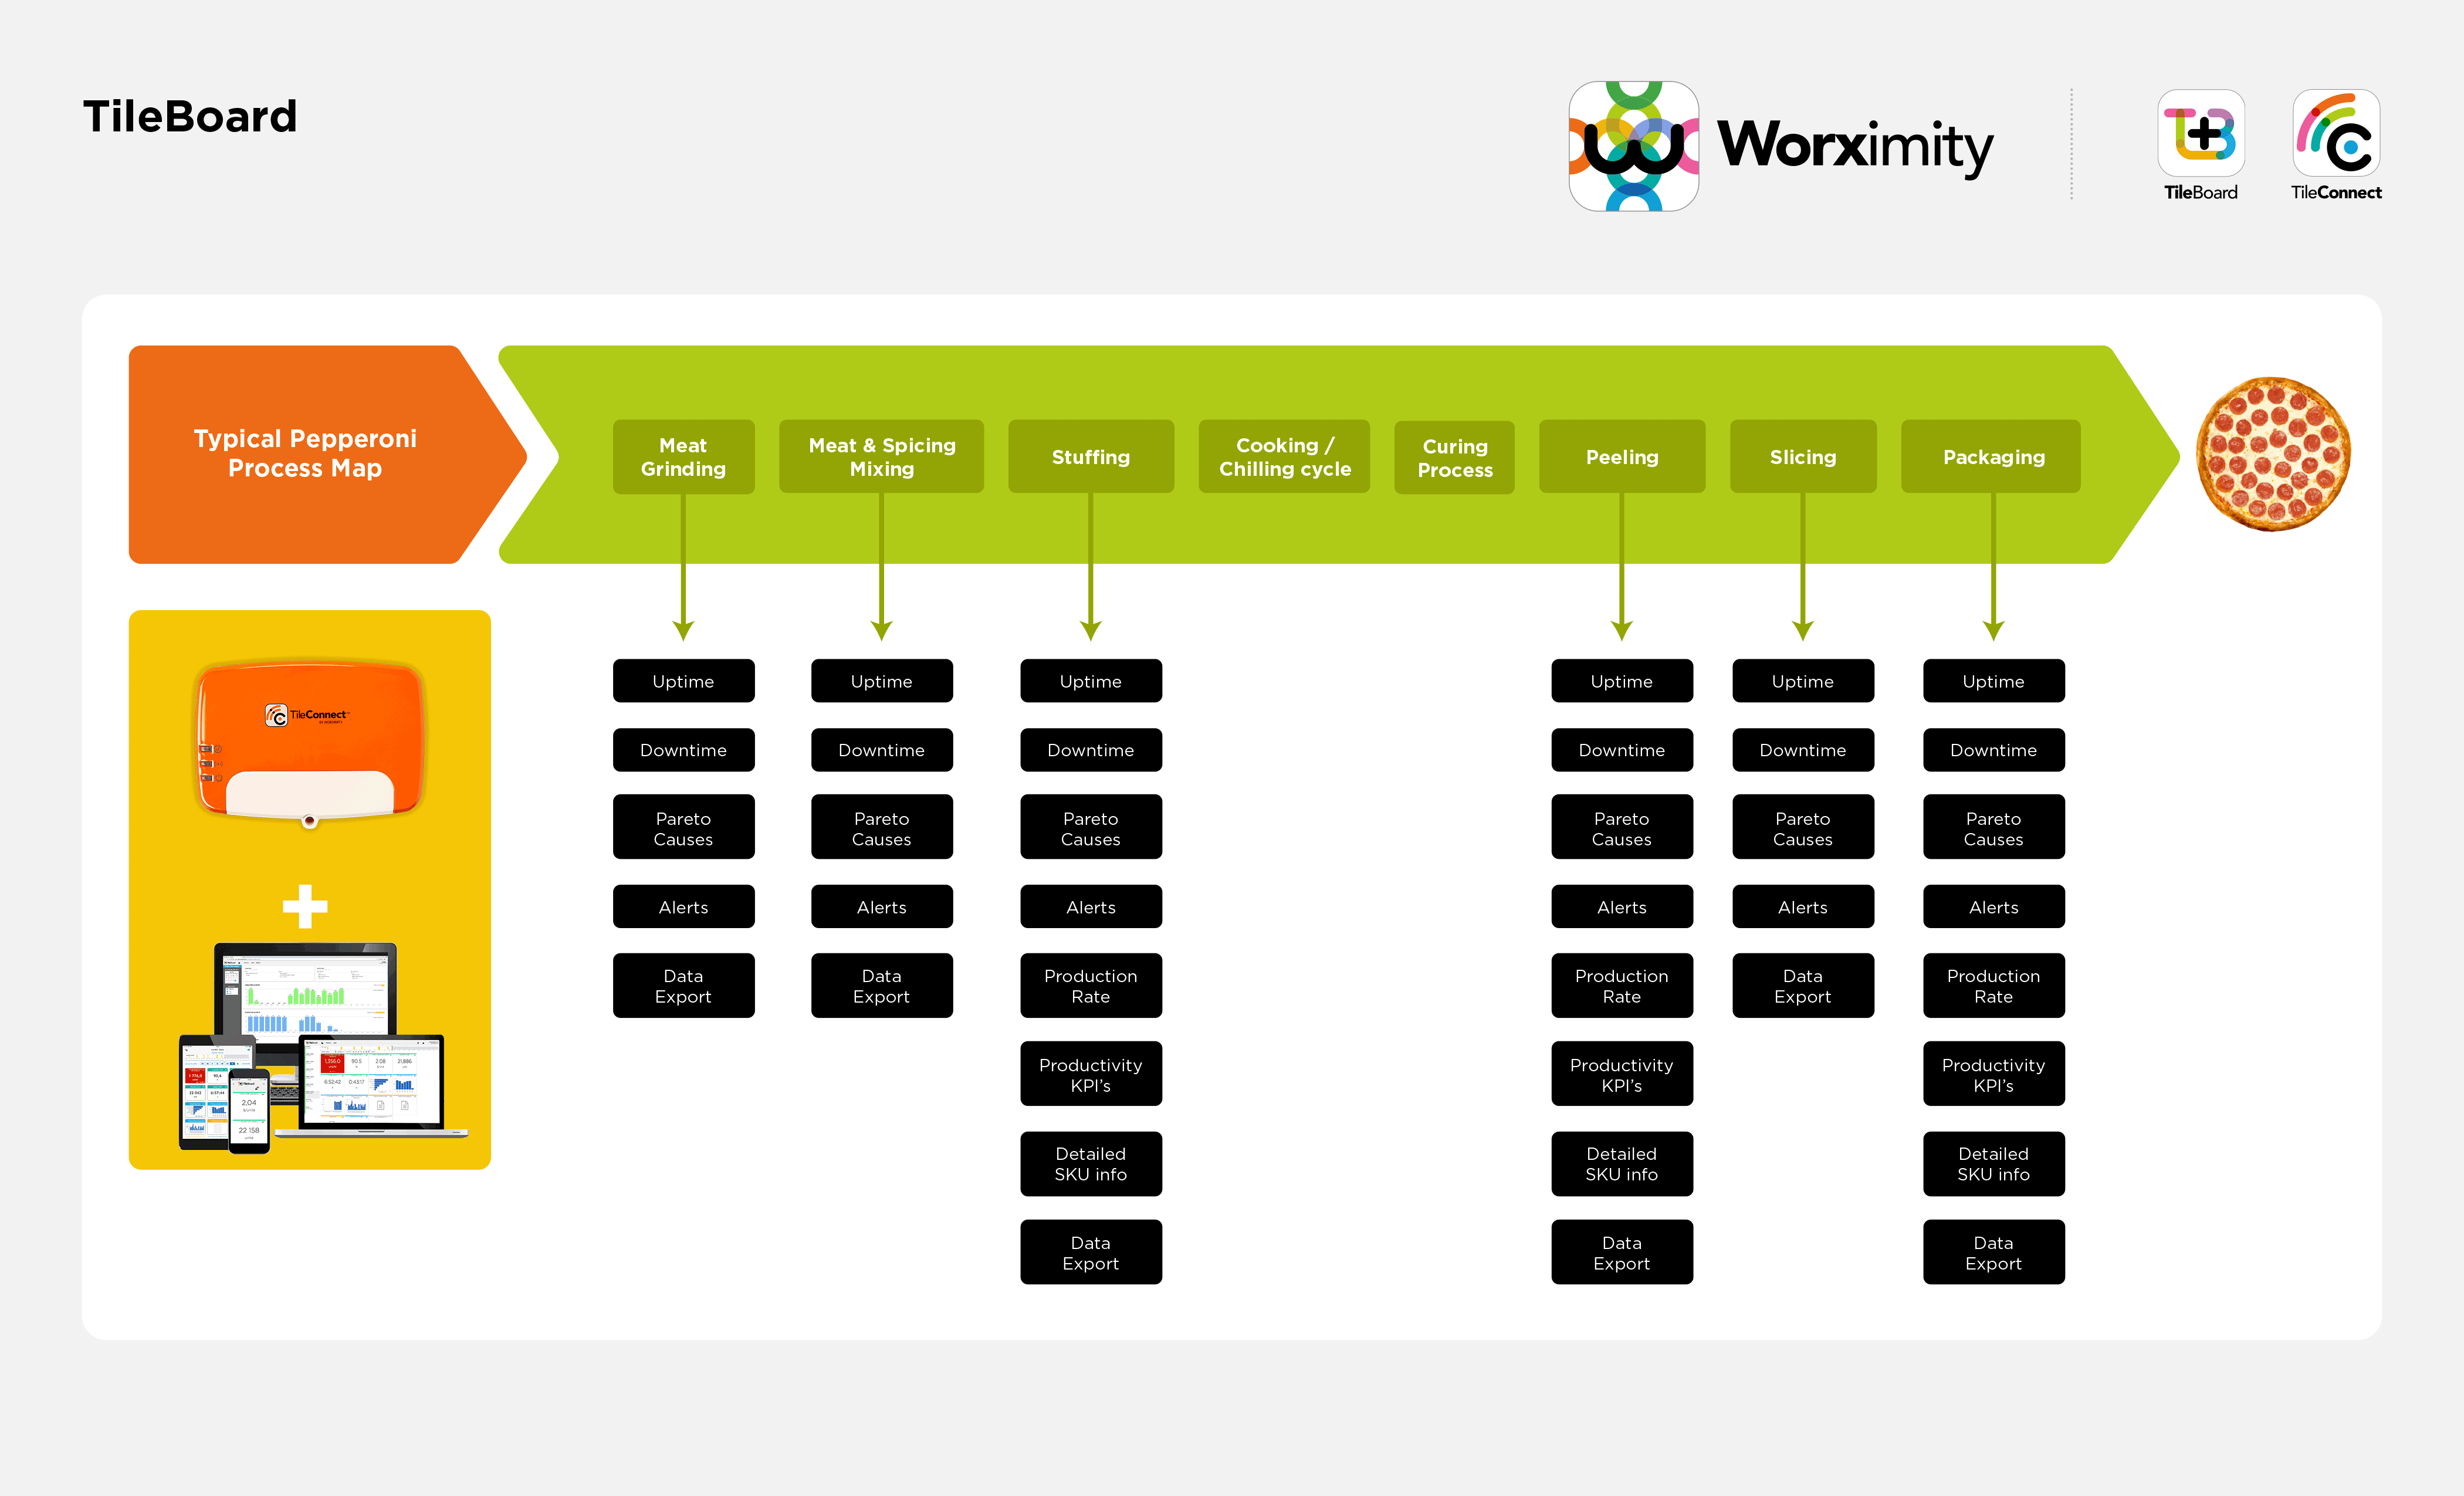
Cet article montre comment la solution de monitoring de la production en temps réel de Worximity peut aider les entreprises manufacturières à collecter et à transformer rapidement les données d'exploitation en indicateurs clés de performance qui contribuent à stimuler la productivité.
Essentiellement, Worximity capture les données des équipements (anciens et nouveaux) ou des lignes de production via un réseau de capteurs qui communiquent avec notre appareil IoT ou via une connectivité directe à l'automate d'une machine.
Ces informations sont ensuite téléchargées en toute sécurité sur notre infrastructure cloud hébergée par Microsoft Azure. Ici, des algorithmes sophistiqués analysent les données pour extraire et compiler des mesures de performance des opérations manufacturières liées au taux de rendement global de l’équipement.
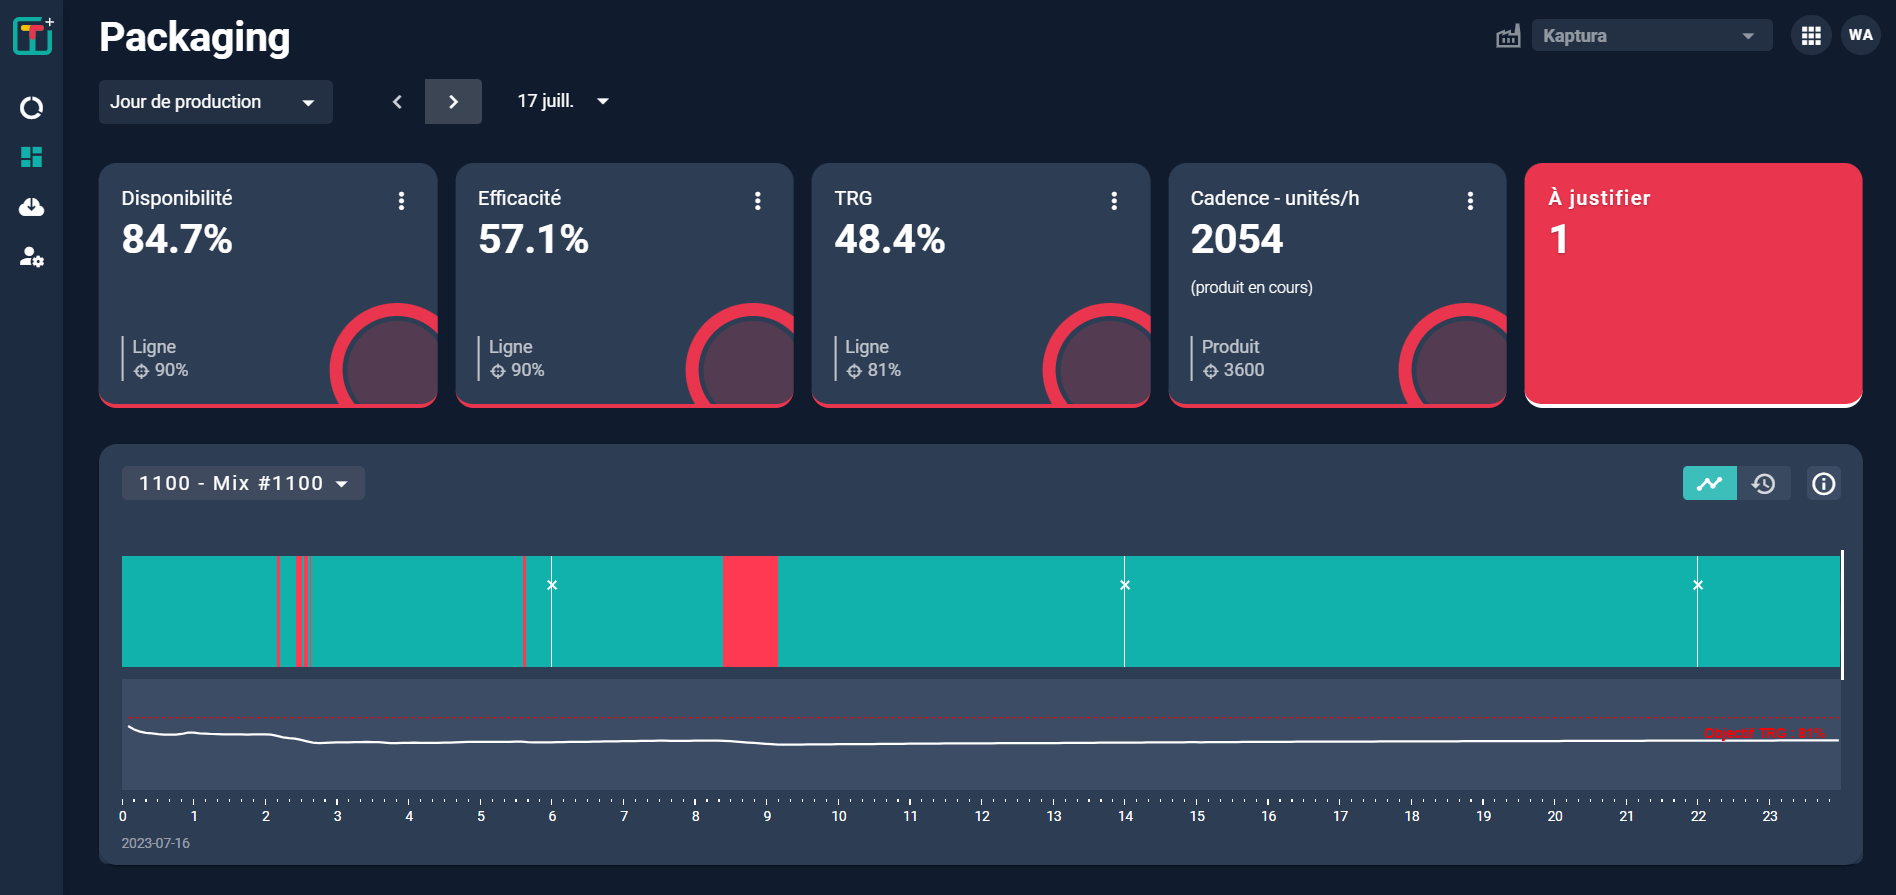
Ces informations sont affichées sur le tableau de bord des indicateurs de performance machine/ligne de production de Worximity, fournissant aux parties prenantes de l'entreprise un portrait complet et en temps réel de la disponibilité, des performances et de la qualité des produits. Examinons de plus près ces indicateurs de performance relier aux opérations.
Indicateurs clés de performance
Les indicateurs clés de performance deWorximity sont répartis en trois grandes catégories:
Disponibilité
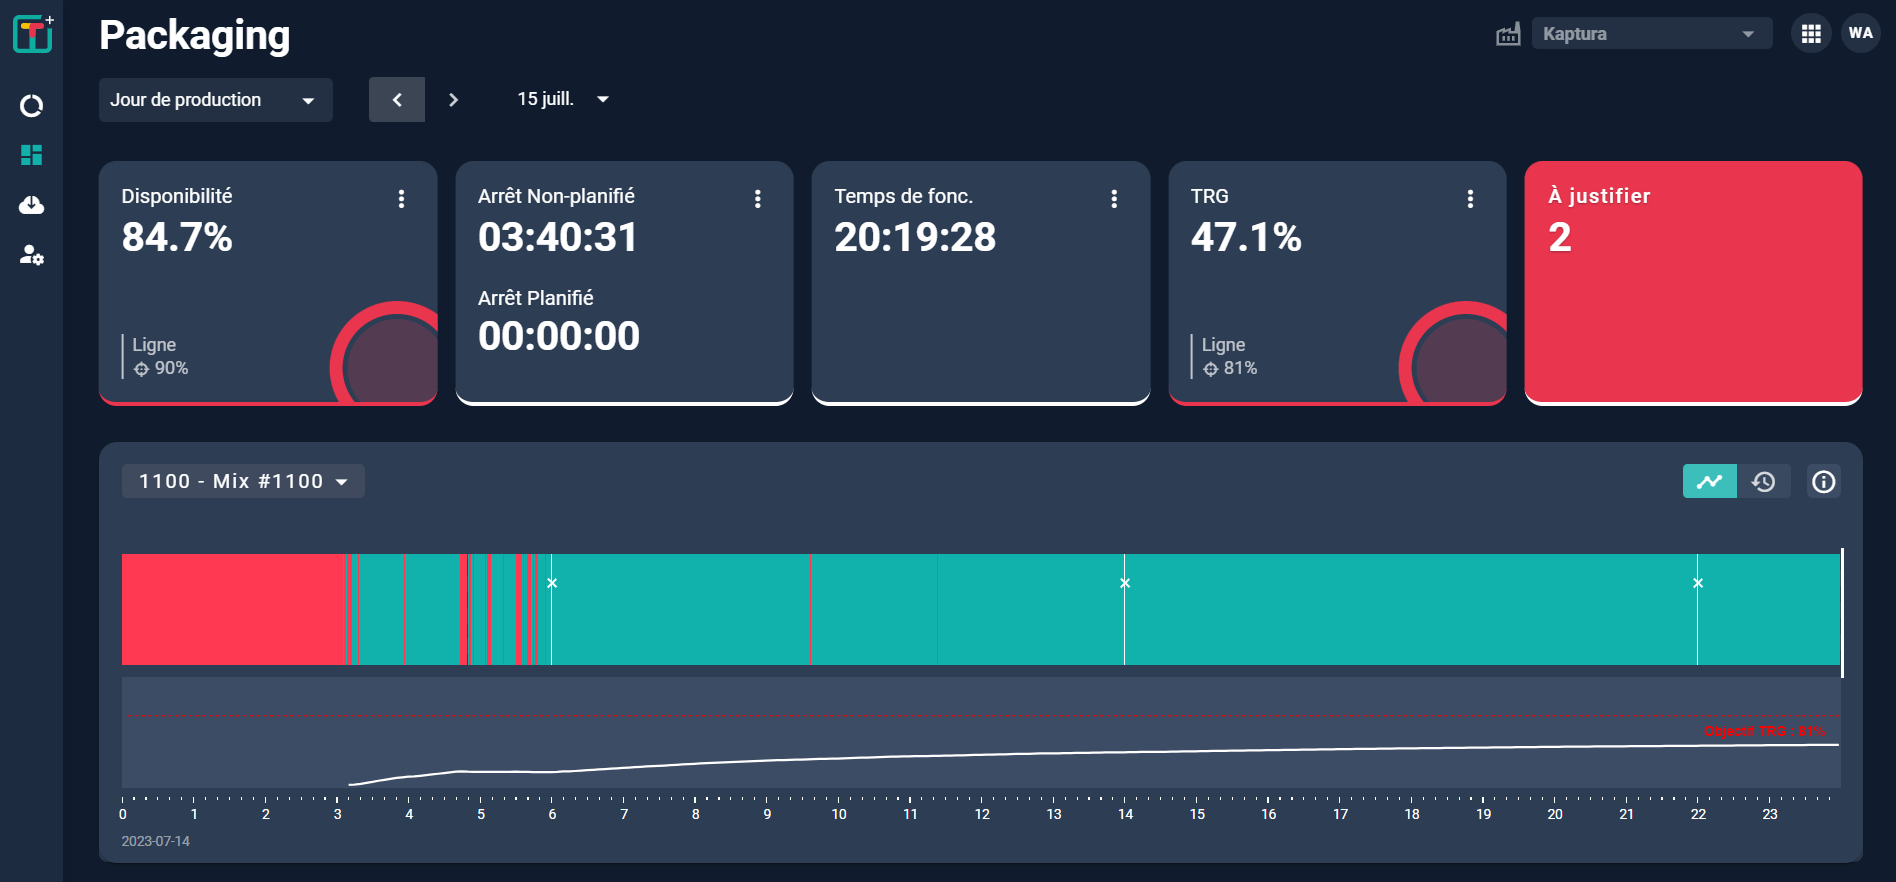
Worximity analyse le pourcentage de temps pendant lequel la chaîne de production/l'équipement produit par rapport au temps de production total. On prend en compte les arrêts pour les pauses, la maintenance, etc. et les temps d'arrêt imprévus. Dans certains cas, l'opérateur devra justifier des temps d'arrêt excessifs. Ce retour d'information permet à la direction de résoudre les problèmes liés à la machine et/ou à l'opérateur et de comprendre les principales raisons des interruptions de production.
Les indicateurs clés de performance liés à la disponibilité incluent:
· Quantité et durée des arrêts planifiés et non planifiés*
· Disponibilité
· Des temps d'arrêt à justifier
*L’utilisateur peut configurer les temps d'arrêt planifiés et non planifiés dans les paramètres de son compte.
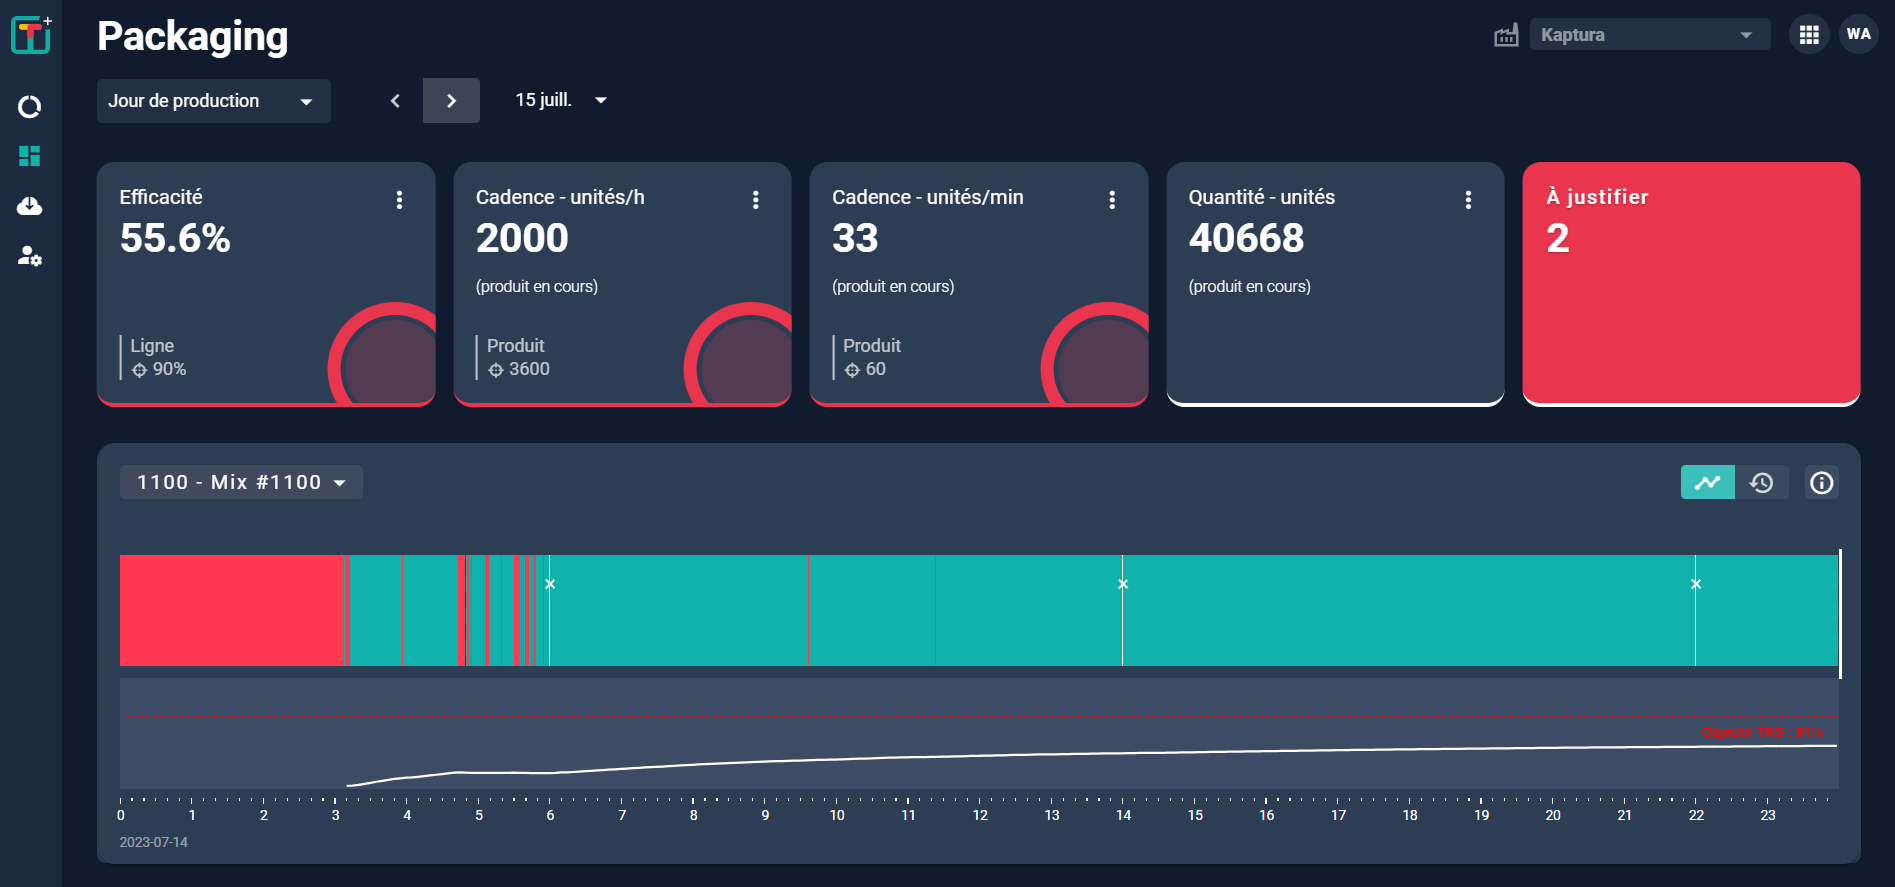
Performance
La performance (également appelée efficacité)est le rapport entre le taux de production réel du produit sélectionné et le taux cible. Ceci est présenté en termes de taux horaire moyen SKU actuel.
Les indicateurs clés de performance qui sont disponibles sur le tableau de bord machine/ligne de Worximity sont notamment :
· Cadence de production/heure
· Cadence de production/minute
· Vitesse sur les 5 dernières minutes
Qualité
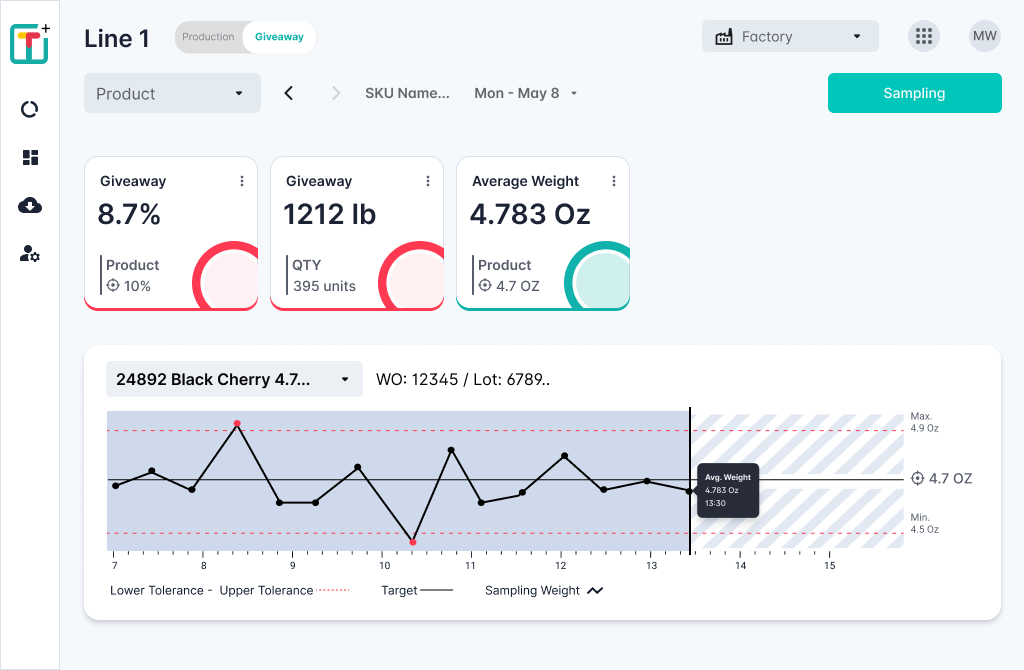
La vitesse et l'efficacité de la production sont importantes, mais pas au détriment de la qualité. Worximity suit le pourcentage de rejets par rapport à toutes les pièces/produits fabriqués pour un SKU spécifique. Ceci est présenté en termes de qualité du produit et activé via un formulaire de rejet qui permet aux opérateurs de suivre numériquement leurs quantités de rejets.
La technologie de Worximity permet également la numérisation du monitoring de la surproduction via la connectivité aux balances de table ou aux balances de contrôle de poids en ligne. Le poids total et moyen du produit est calculé et mesuré par rapport à une cible pour fournir aux utilisateurs les quantités et pourcentages de surproduction.
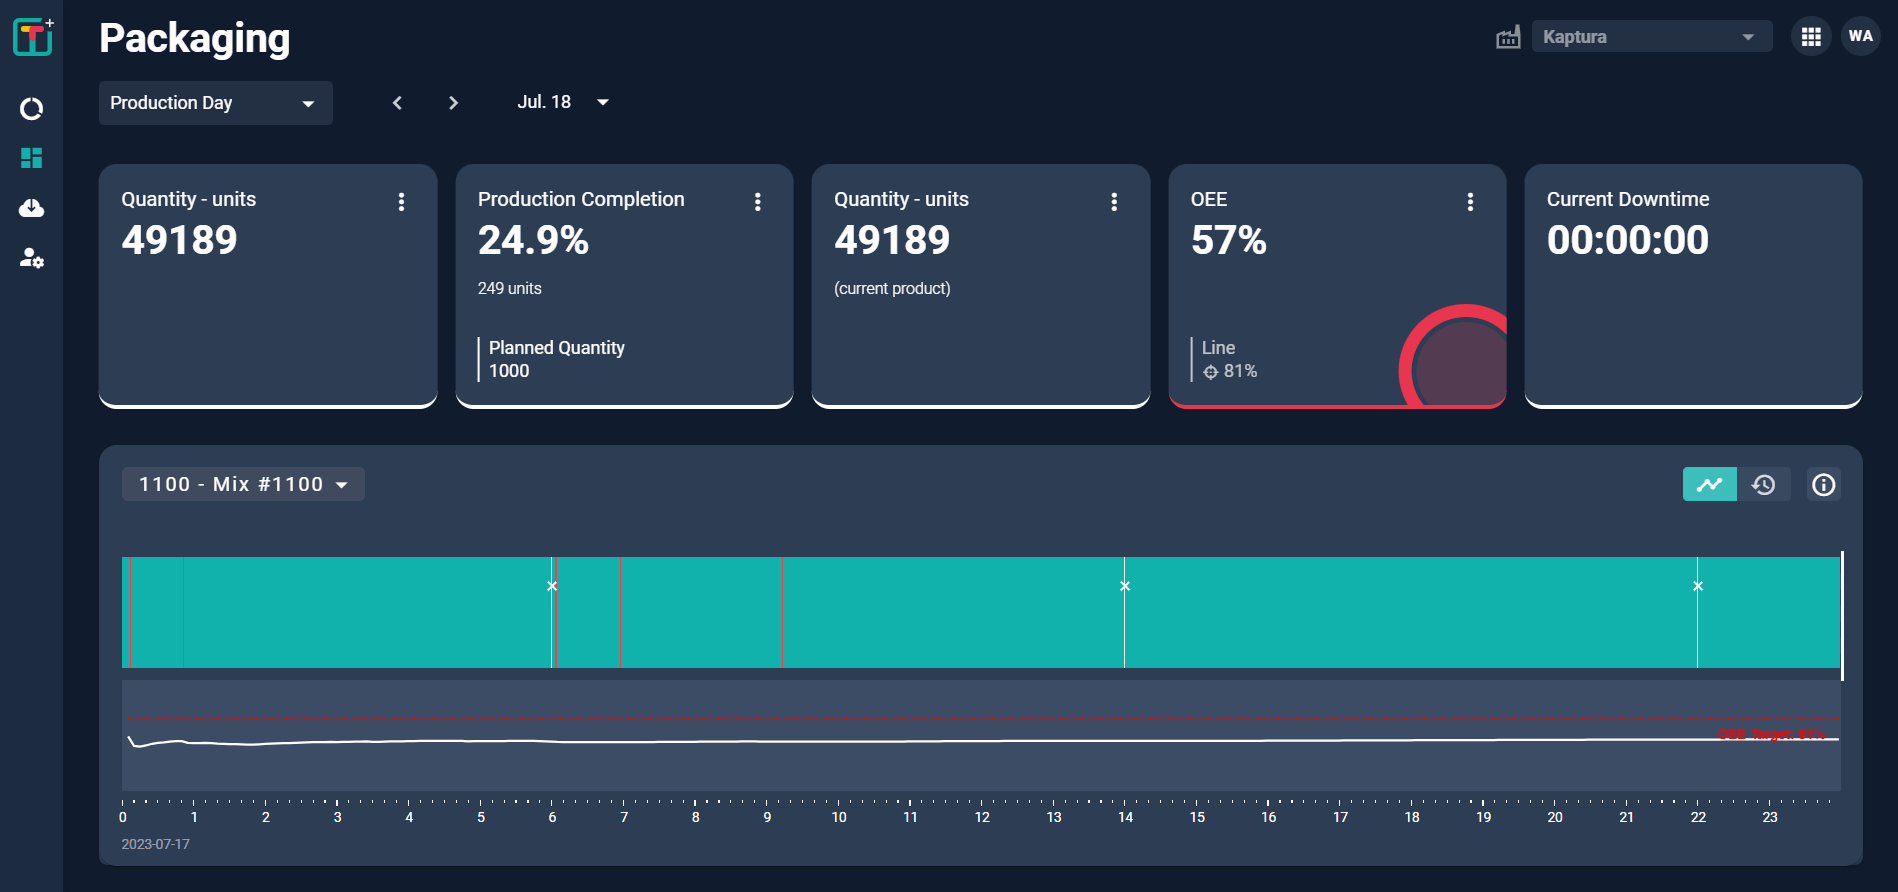
Autres indicateurs de performances relier à la production
Comme pour tout travail, il est important de comprendre où vous en êtes par rapport aux objectifs pour rester motivé et responsable. C'est pourquoi Worximity fournit aux opérateurs en usine des mesures de performance de production en temps réel telles que
• Quantités produites
• Taux d'achèvement (qui calcule le ratio de la quantité produite par rapport à l’objectif)
Chacune de ces mesures est disponible par heure, équipe et jour de production sur une machine ou une ligne de production sélectionnée.
De plus, Worximity tire parti de la connectivitéAPI pour intégrer de manière transparente sa technologie à une large gamme de systèmes de back-office, y compris les ERP. Cette intégration élimine le besoin d'interventions humaines excessives et de tâches redondantes, car elle automatise les entrées essentielles telles que les modifications de produits et d'ordres de travail, les quantités planifiées, les listes de produits, les raisons des temps d'arrêt et la gestion des utilisateurs.
Cela augmente l'efficacité et réduit la probabilité d'erreurs, ce qui permet à votre équipe de se concentrer sur des tâches à plus forte valeur ajoutée.
Votre partenaire en matière de mesures des performances manufacturières
Vu de l’extérieur, la collecte et la transformation de données brutes en mesures significatives peuvent sembler être une solution de boîte noire. Le logiciel de Worximity est tout sauf cela. Notre solution de mesure des performances manufacturières repose sur des années d'expérience pratique dans le secteur manufacturier, une méthodologie innovante et une technologie éprouvée.
Contactez-nous en cliquant ici pour plus d'informations ou pour réserver une démonstration