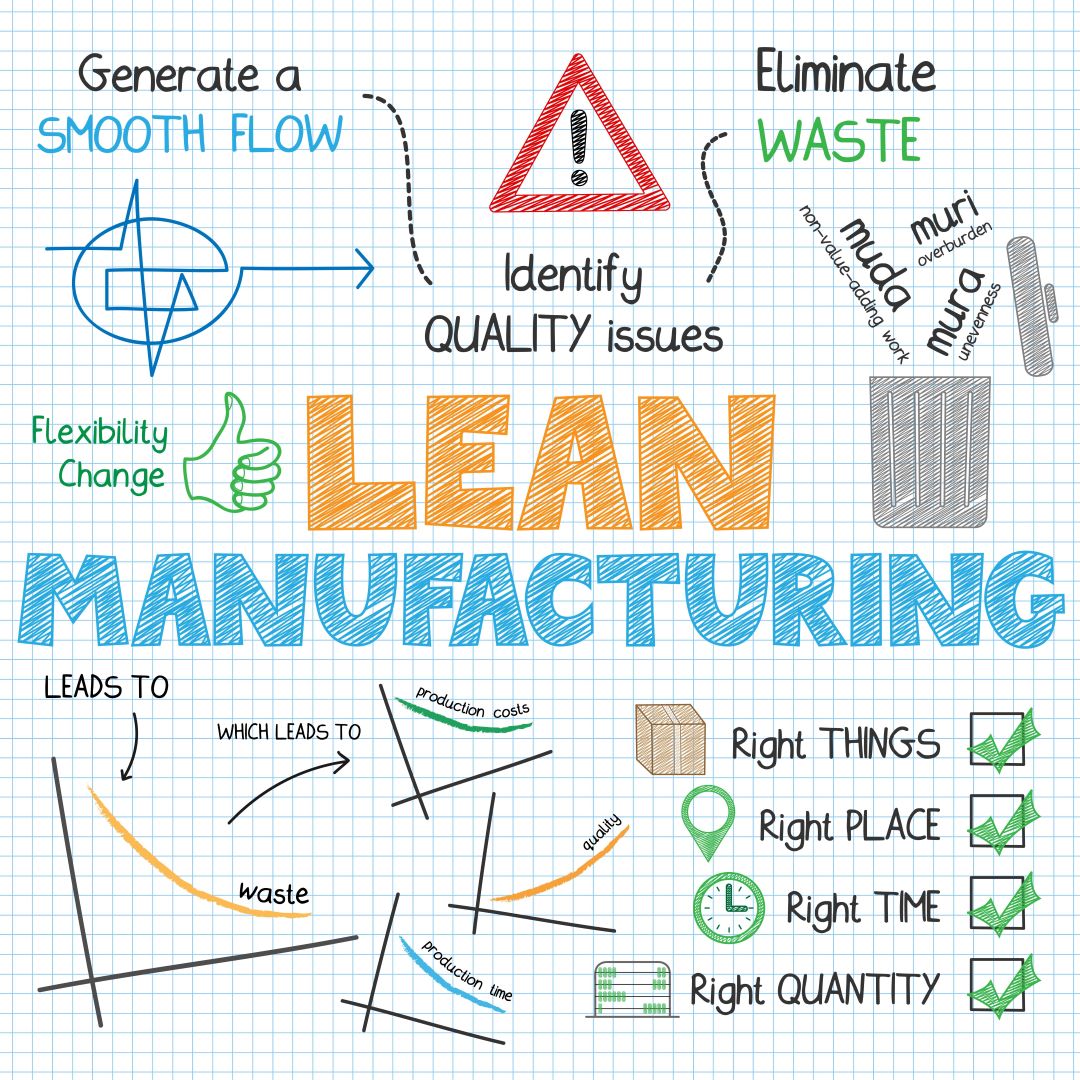
The overall equipment effectiveness (OEE) measure can provide plant managers and supervisors with valuable information upon which operating decisions can be made. Being able to use OEE effectively, however, means understanding the metric's strengths and weaknesses.
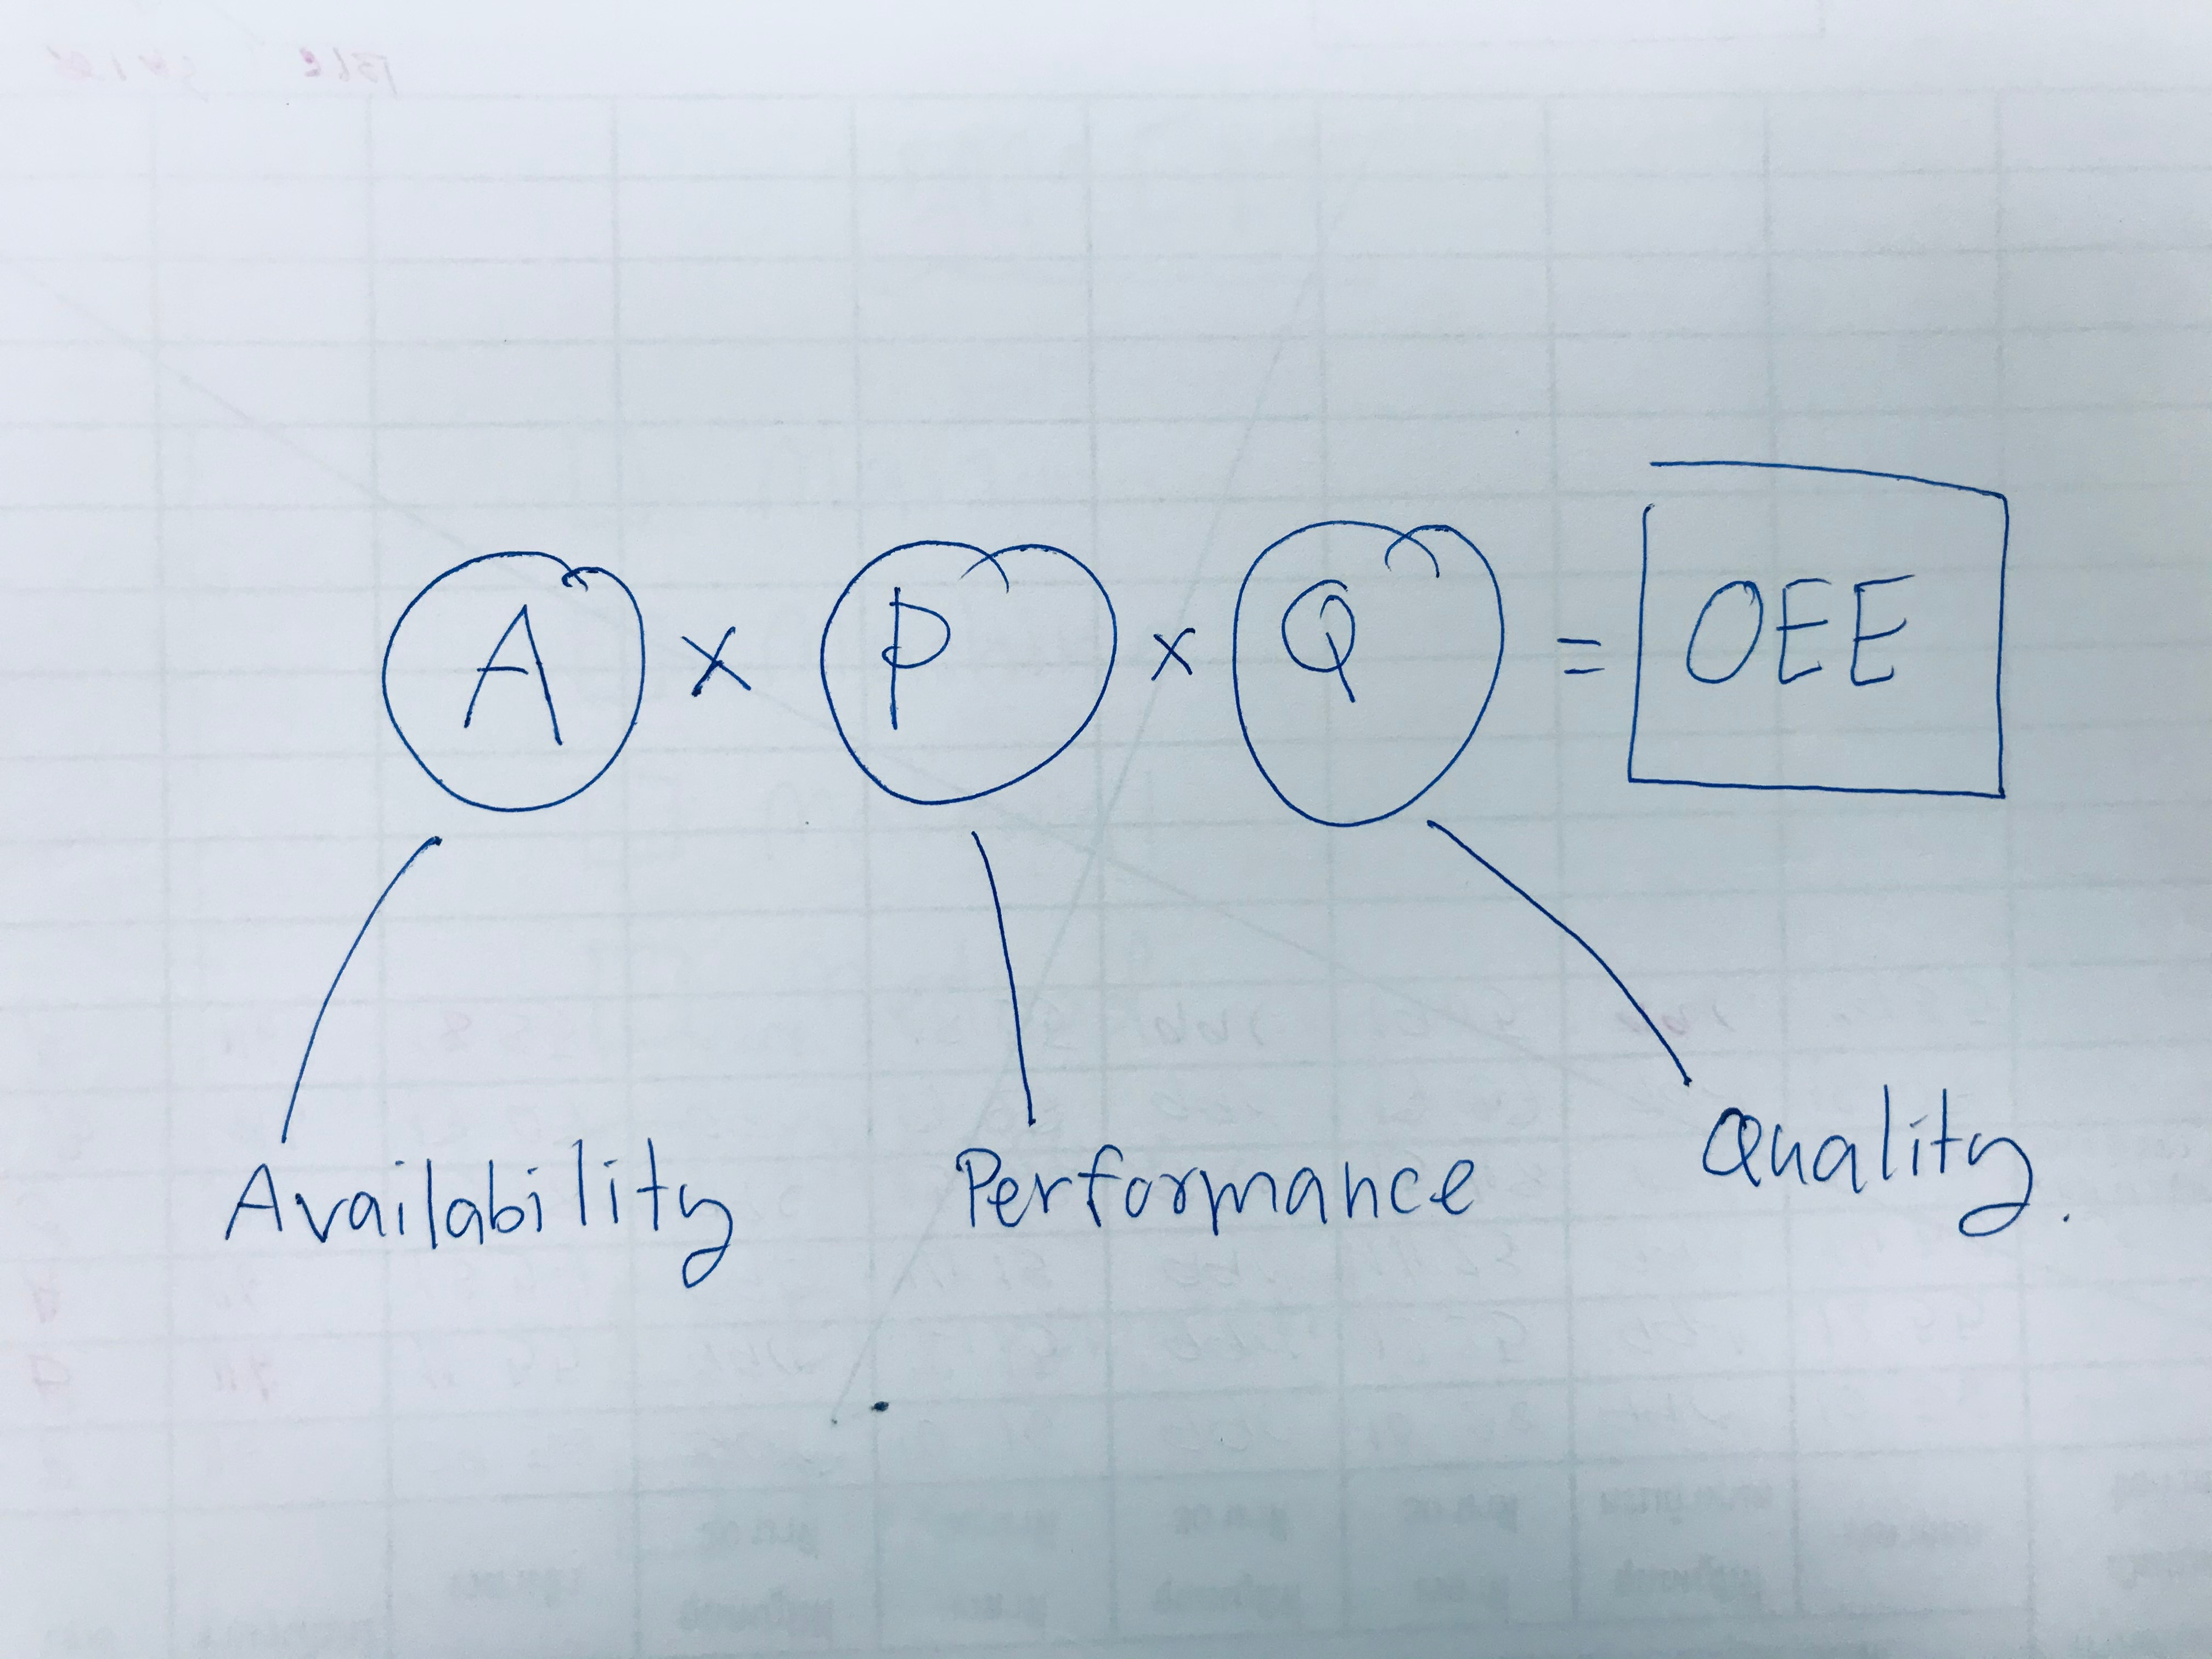
OEE is computed by using actual production line data from three primary areas: availability, performance, and quality. Values or scores for each area are multiplied together to arrive at the OEE value for the period studied. The resulting OEE value gives managers an excellent measure of overall process effectiveness.
The value of any tool, including OEE, depends on both the quality of the data collected and how that data is manipulated to arrive at a final result. When mistakes enter into either the methods of data collection or the methods used to calculate OEE, the measure loses much of its usefulness. Below are seven mistakes every manager should avoid when using or calculating OEE.
1. Not Analyzing OEE Component Scores
OEE is an important gauge of the effectiveness of a particular process. However, the underlying component scores used to calculate OEE (availability, performance, and quality) are just as important in evaluating operating conditions. For example, a high availability score may obscure a lower-than-desired quality score, even if the calculated OEE value appears satisfactory.
In other words, the process might be up and running, but part quality may not be at a desirable level. By analyzing all components of OEE, a manager can detect underlying deterioration in any single element and make process adjustments. Managers should look at the OEE's component scores to confirm all elements of the process are supporting each other.
2. Comparing Dissimilar Operations, Processes, or Equipment
OEE values for different processes may vary according to the constituent parts making up the value. For this reason, it is not helpful to compare OEE values for a line that has only one changeover per day to a line that has four or five changeovers per day. In this case, the OEE values will be significantly different. OEE works best when used for individual pieces of equipment, processes, or lines.
3. Not Including All Employees in Process Improvements
Line employees represent a valuable front-line resource for improving processes. Including all line employees in improvement projects increases the acceptance of needed changes. In addition, when included, employees tend to feel more:
- Responsible for their work
- Motivated
- Confident in the processes
- Willing to contribute ideas and suggestions
4. Using Manual Methods for Data Collection
Manual methods of data collection tend to produce both insufficient data and poor-quality results. Employees charged with manually collecting operating data may miss readings, overlook essential changes, or “fudge” numbers. It is also unlikely that a manual system will be able to generate sufficient data to produce satisfactory outcomes. In addition, the lengthy cycle time required to collect, calculate, and distribute OEE reports may minimize the usefulness of the results.
5. Using Planned or Average Rather Than Rated Equipment Speeds for OEE Calculation
Equipment run speed is one factor in calculating OEE. In some cases, managers elect to use either the scheduled or average equipment speed rather than the nameplate or rated speed for this calculation. Using a lower planned speed value can increase the OEE score, but it hides the fact there are improvement opportunities available. The actual number that should be used is the rated equipment speed, as determined by the original manufacturer.
6. Including Parts That Need to Be Reworked in the Count of 'Good' Parts
A common practice with OEE to determine quality is to measure the quality of parts coming off of the line at the end of the first process pass. Thus, when calculating the quality score to use in determining OEE, any part that needs to be reworked should not be included. Including these parts hides the fact that opportunity exists for improving first-pass process quality.
7. Failure to Collect Accurate Source Data and Verify Its Accuracy
The development of useful OEE values depends on gathering accurate and timely data. If you want to create an improvement program using results from OEE, the data used in the calculations should be accurate, timely, appropriate, and of sufficient volume. Manual systems of data collection fail most of these requirements.
Today, data collection devices such as Worximity's TileConnect sensors can easily attach to equipment, gather appropriate data, and transmit this data to Worximity's Smart Factory analytics software. This software (Worximity's OEE monitoring tool) then calculates real-time performance information and displays the results on dashboards (TileBoards) located throughout the factory. Implementing Worximity’s state-of-the-art system helps companies generate valid, reliable, and actionable OEE information and avoid many of the mistakes noted above.
Overall equipment effectiveness can be a powerful tool in gauging how effectively a process or piece of equipment is performing. Tracking both OEE and its components' scores can help identify improvement opportunities. Over time, implemented changes can help factories increase throughput, reduce costs, and improve quality. Worximity provides the equipment and know-how to help any processor develop and implement an effective OEE program.