11 Jul
2018

Worximity's TileBoard: Monitoring Typical Meat Processing KPIs

This infographic shows Wx's TileBoard and a typical meat processing map from start to finish.

Food Manufacturing IIoT
Industry 4.0
Smart Factory
Smart Meat Processing
Worximity's TileBoard: Monitoring Typical Meat Processing KPIs


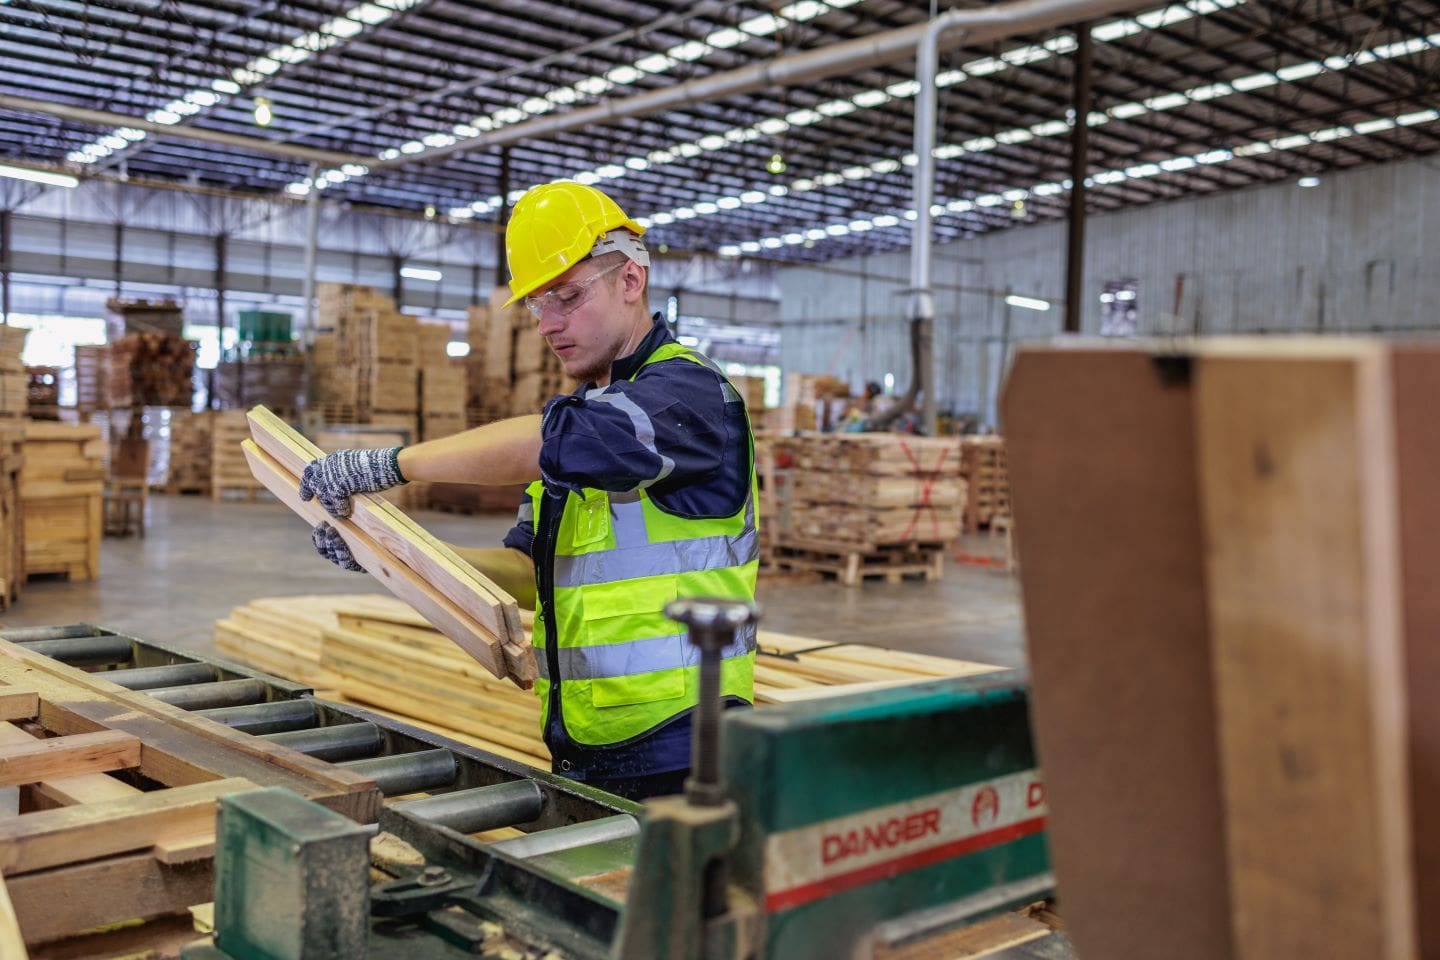
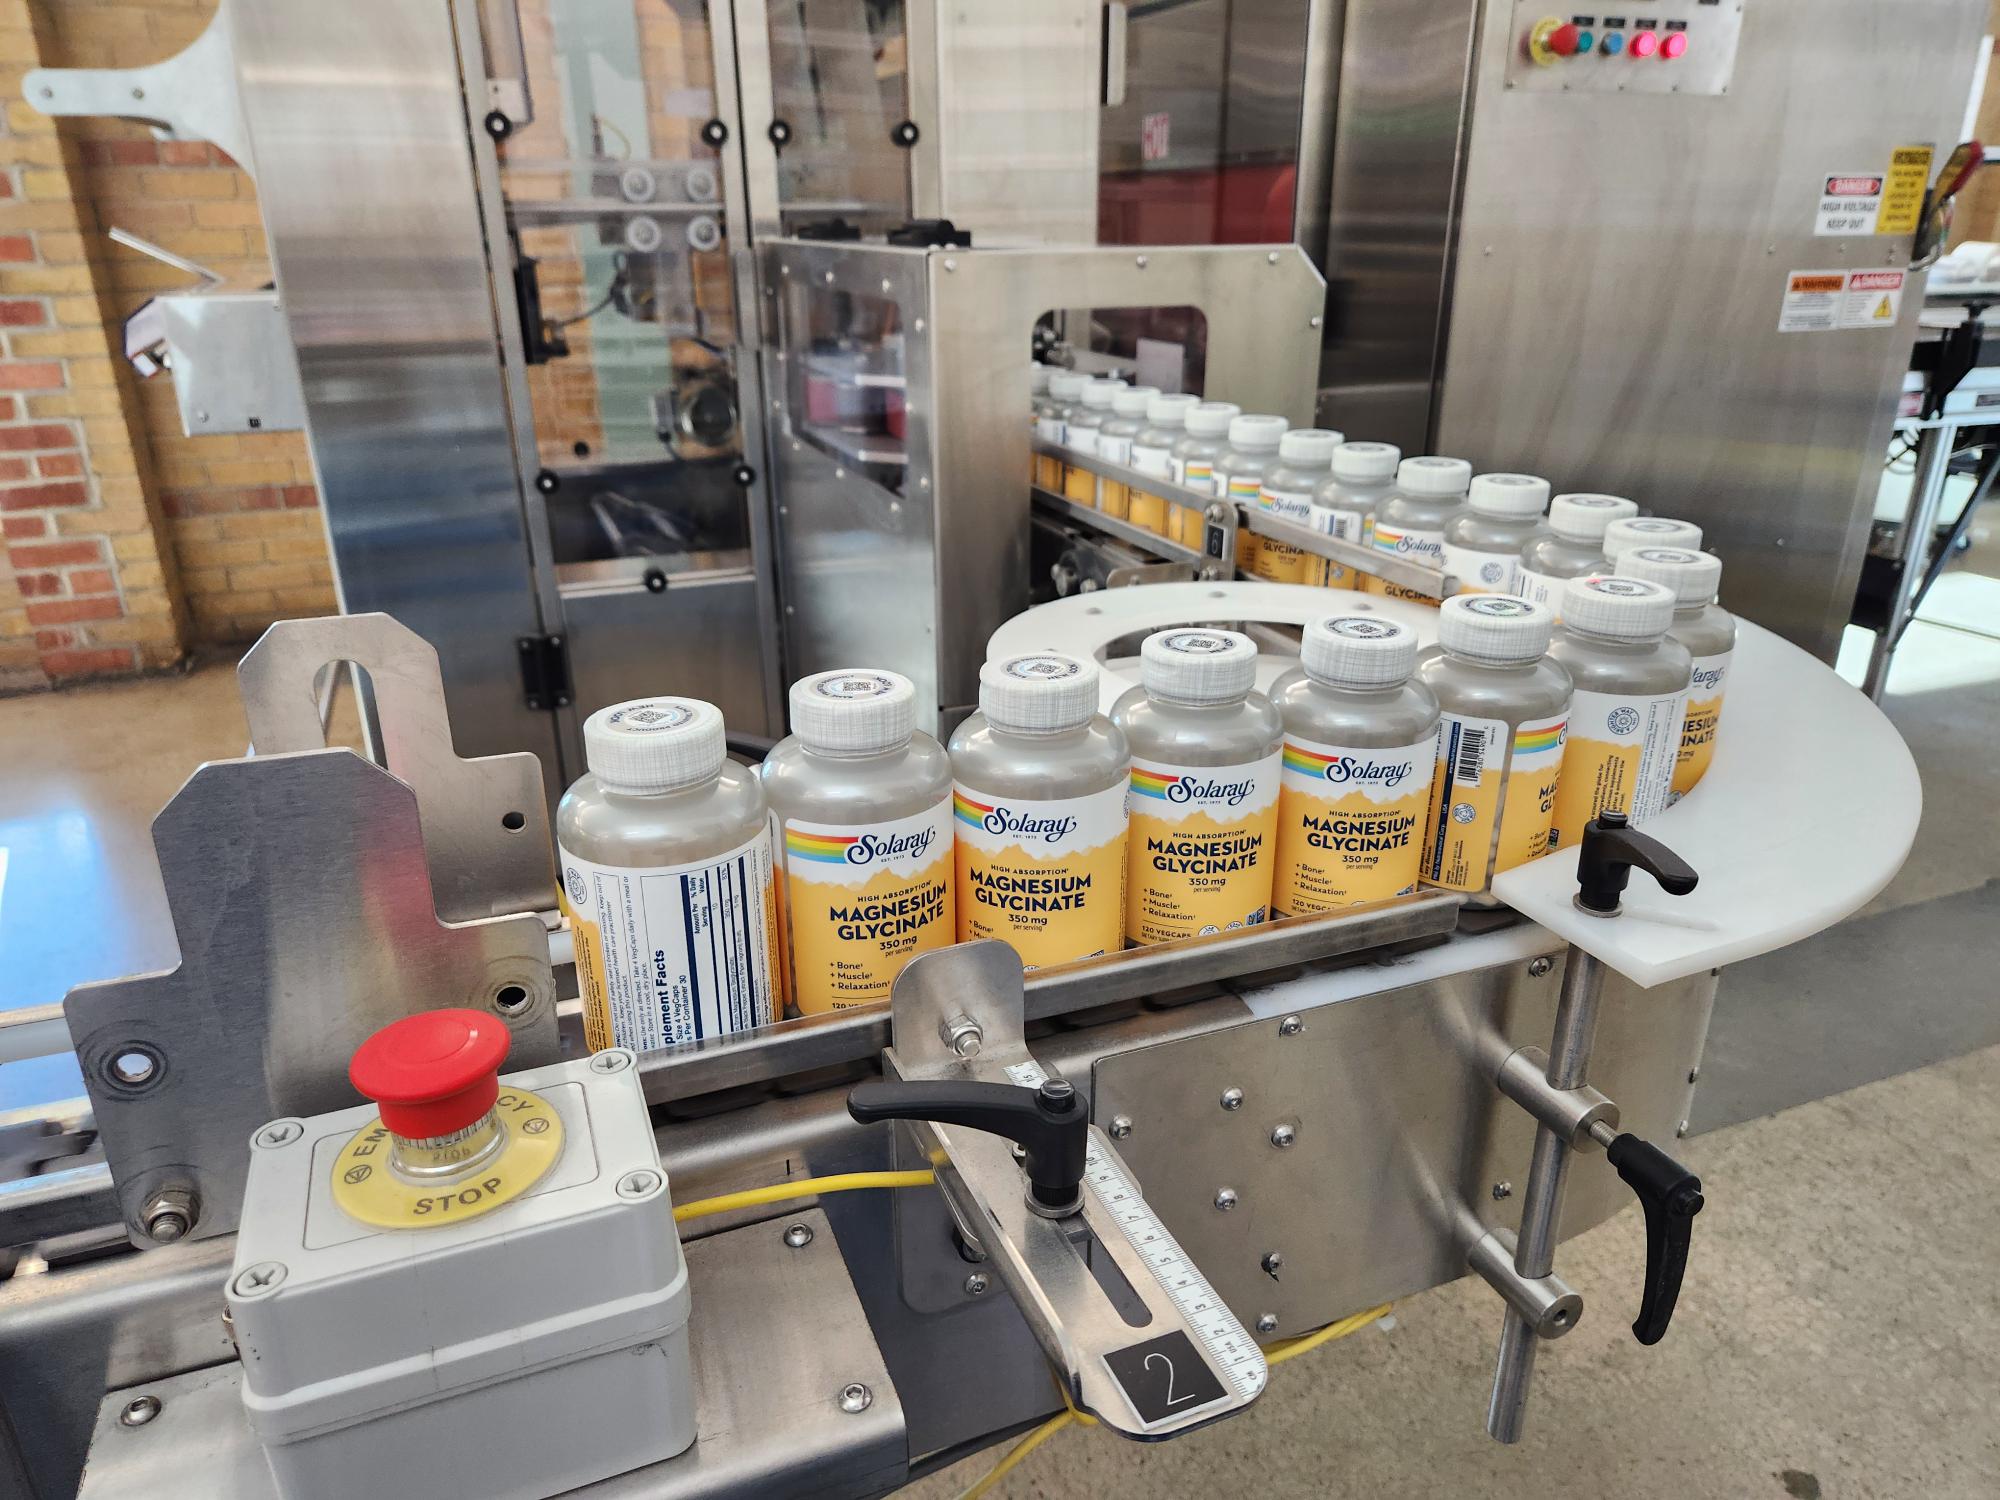
The smart factory set-up using the Worximity TileBoard Production Process

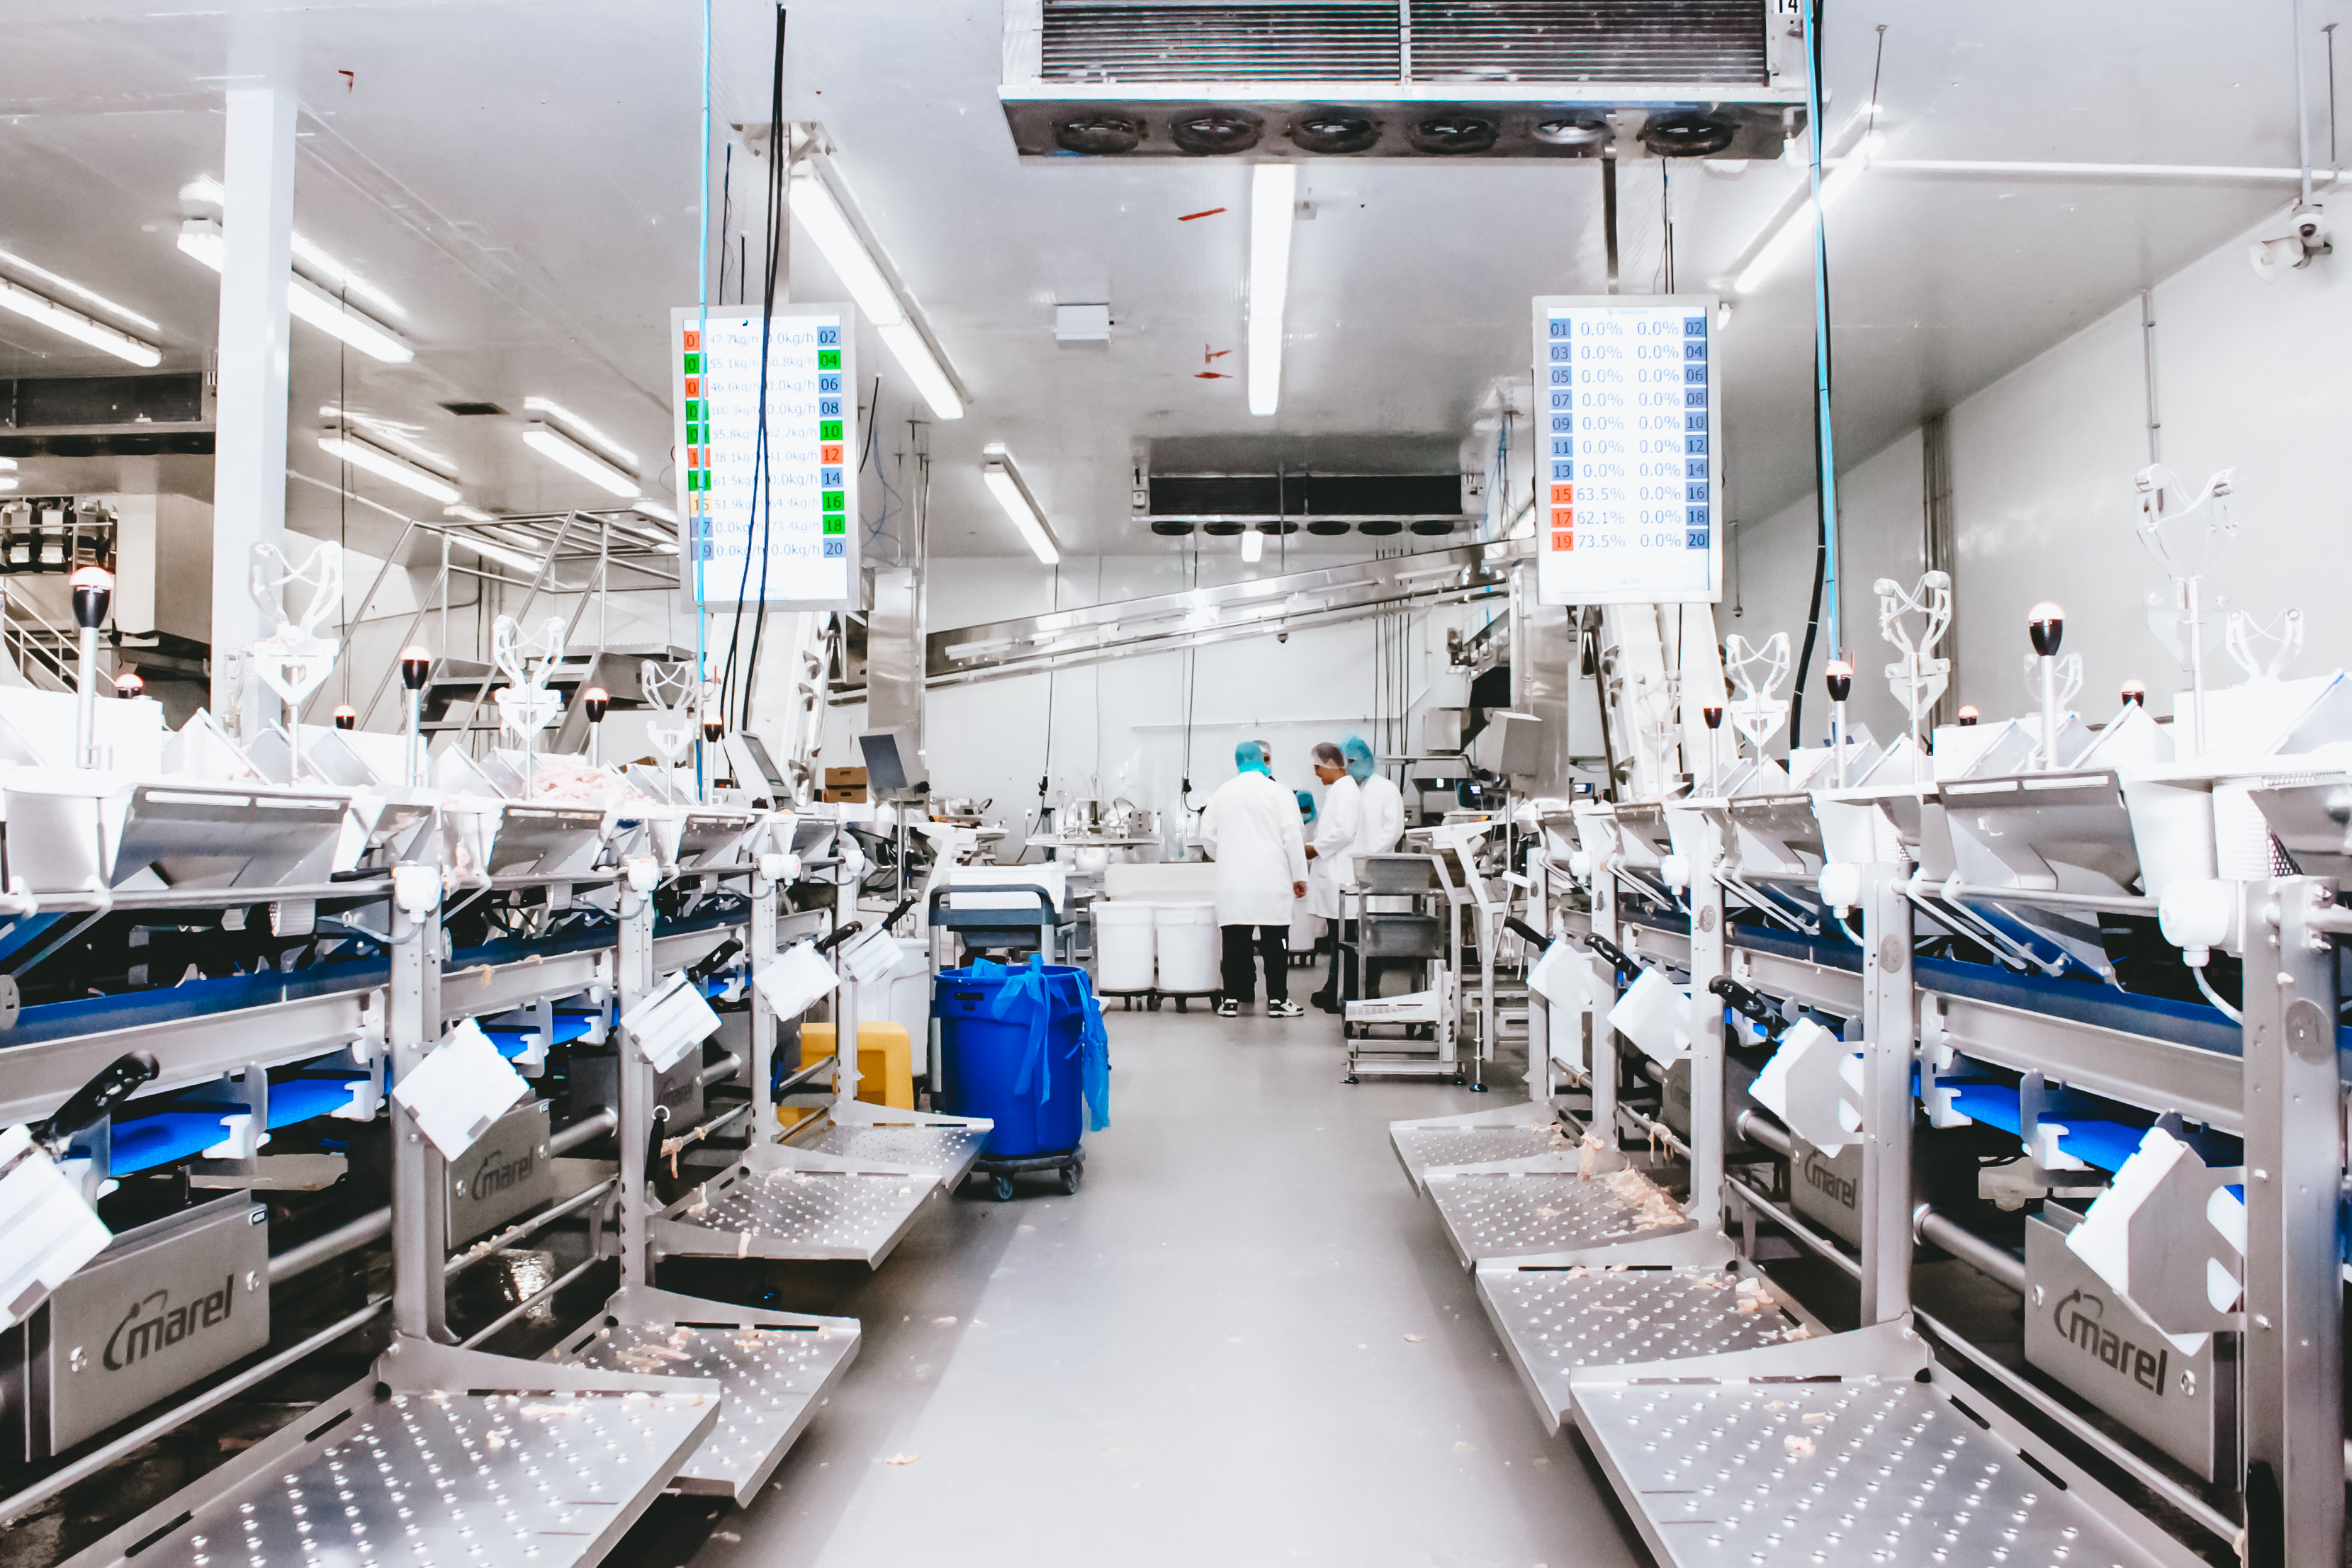
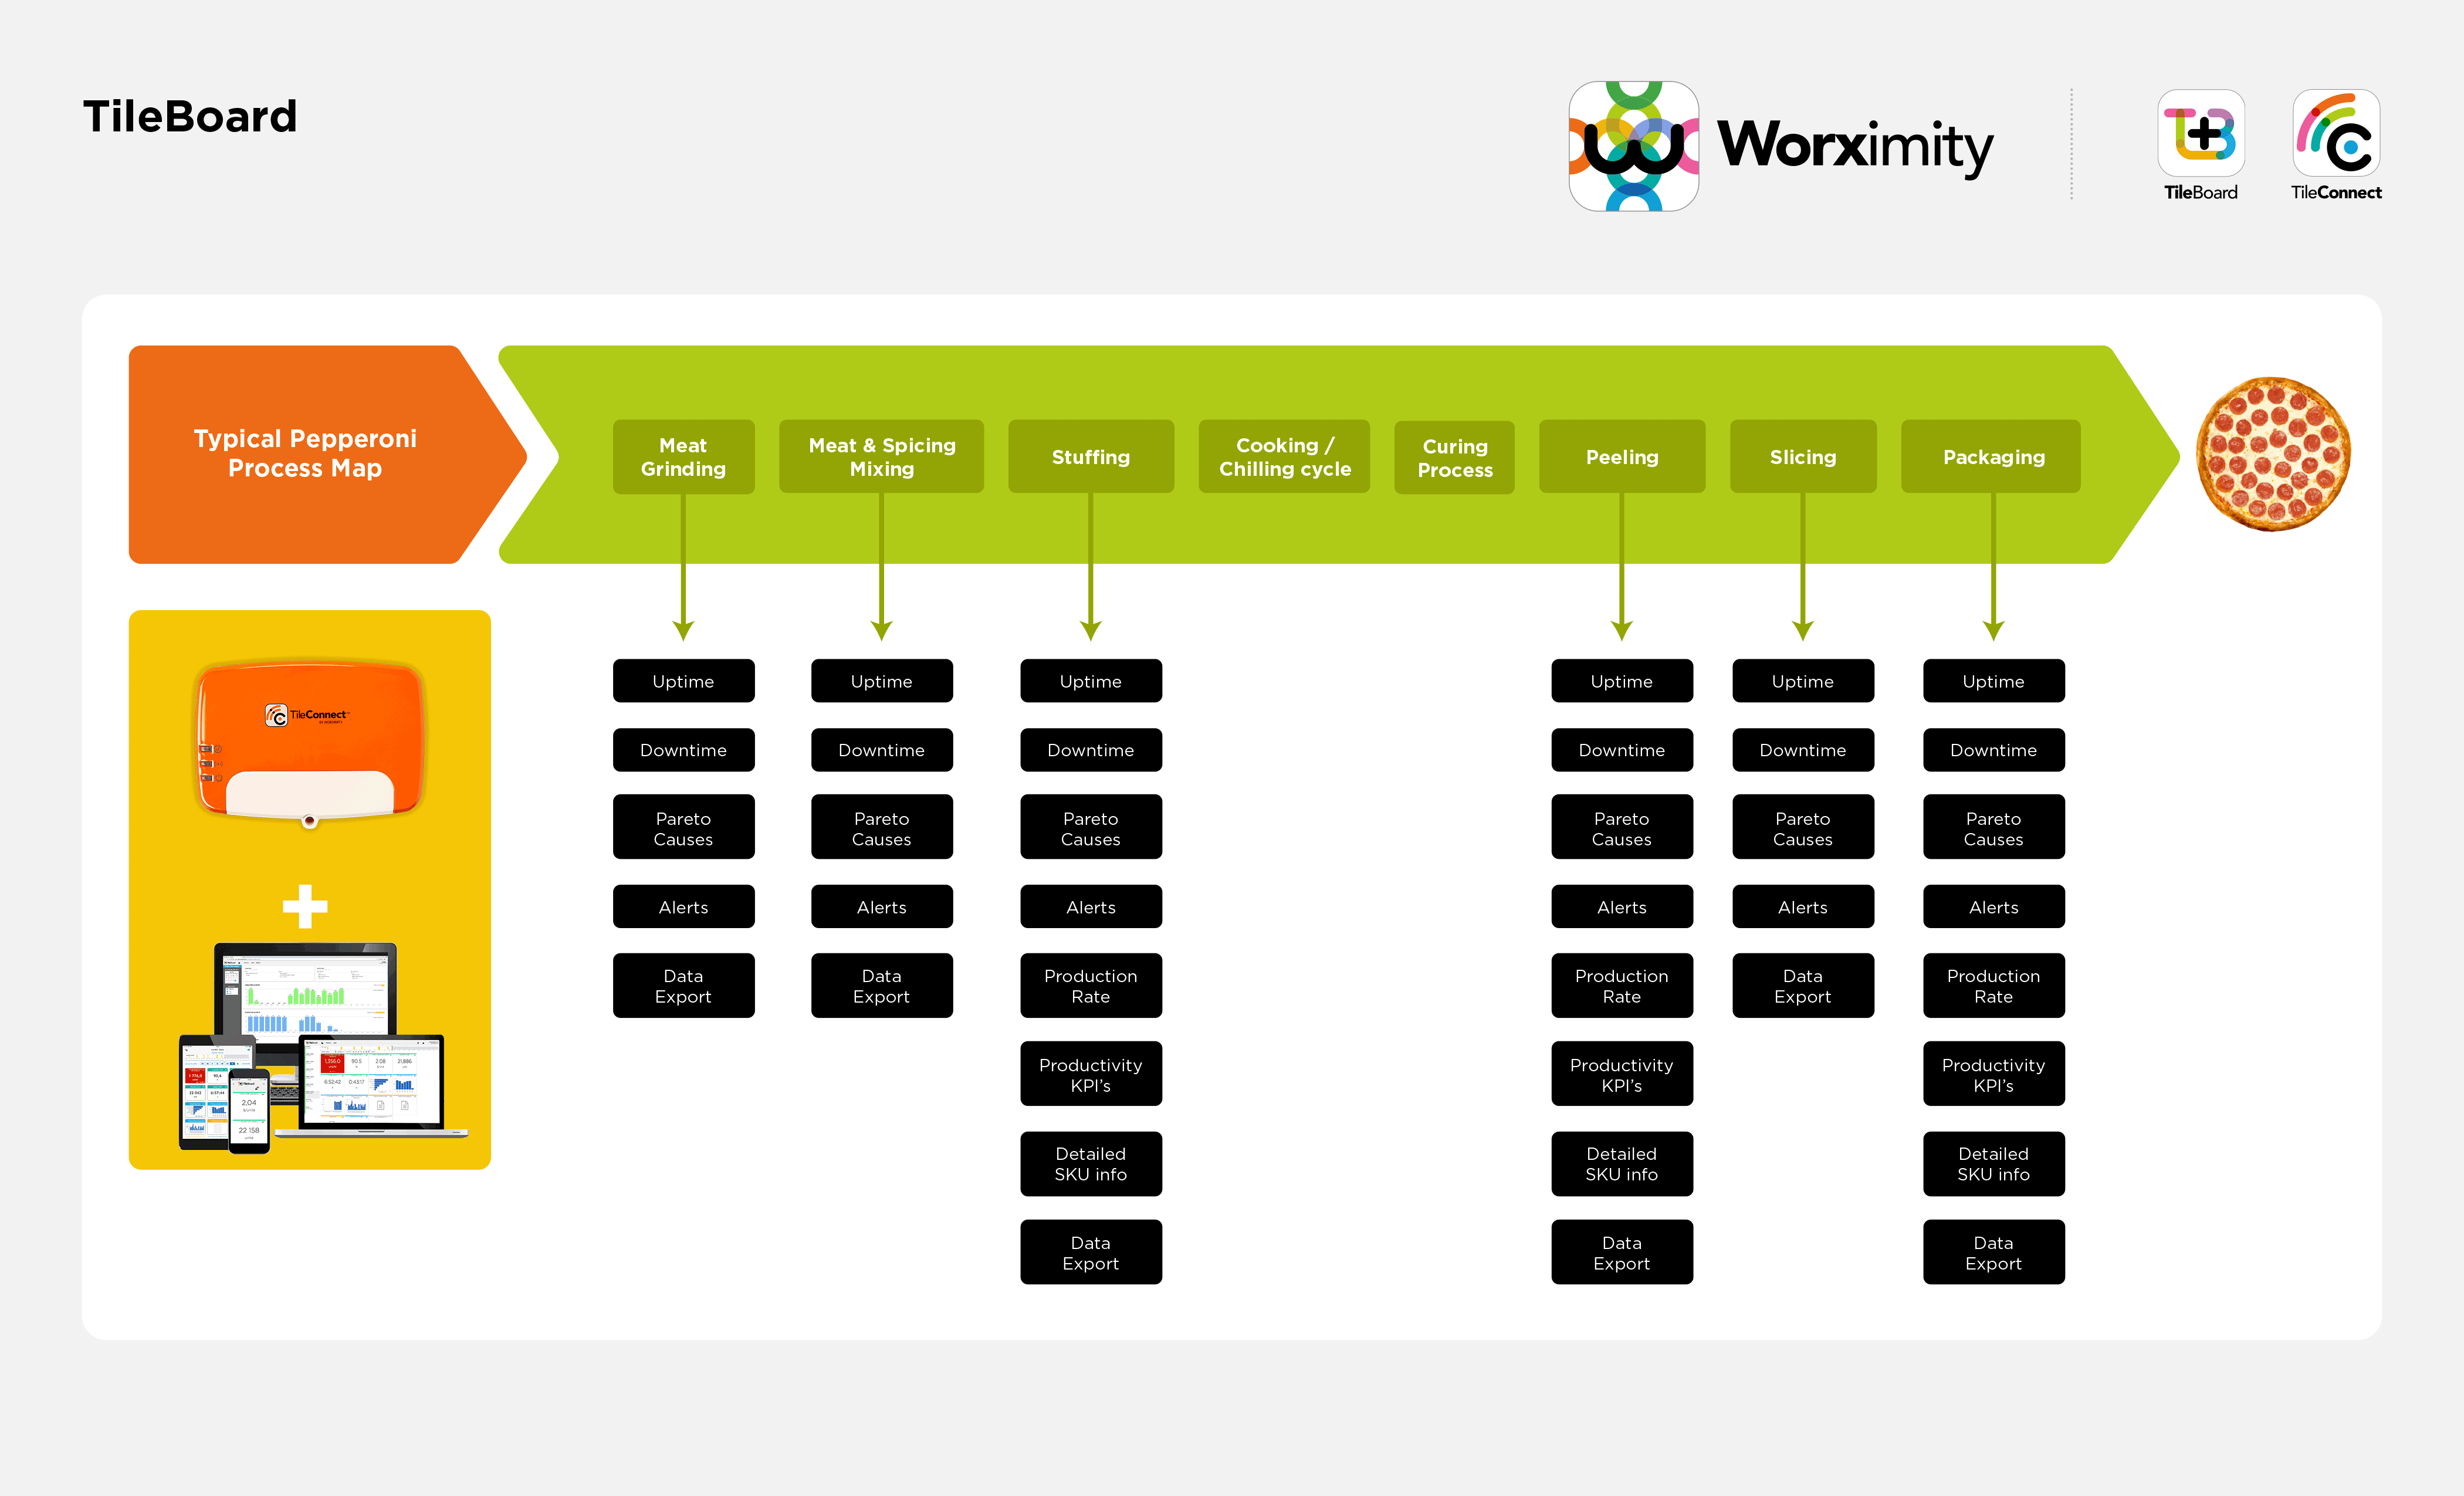
The infographic below outlines the typical KPIs monitored in the deli meat production process from start to finish with Worximity TileBoard in place. Worximity connects all type of machines and all brands : CEIA, Loma, Mettler Toledo, RiceLake, Bizerba.

  1. Uptime
  2. Downtime
  3. Production Rate
  4. Productivity KPIs
Worximity_Meat_Processing_Monitoring_KPIs

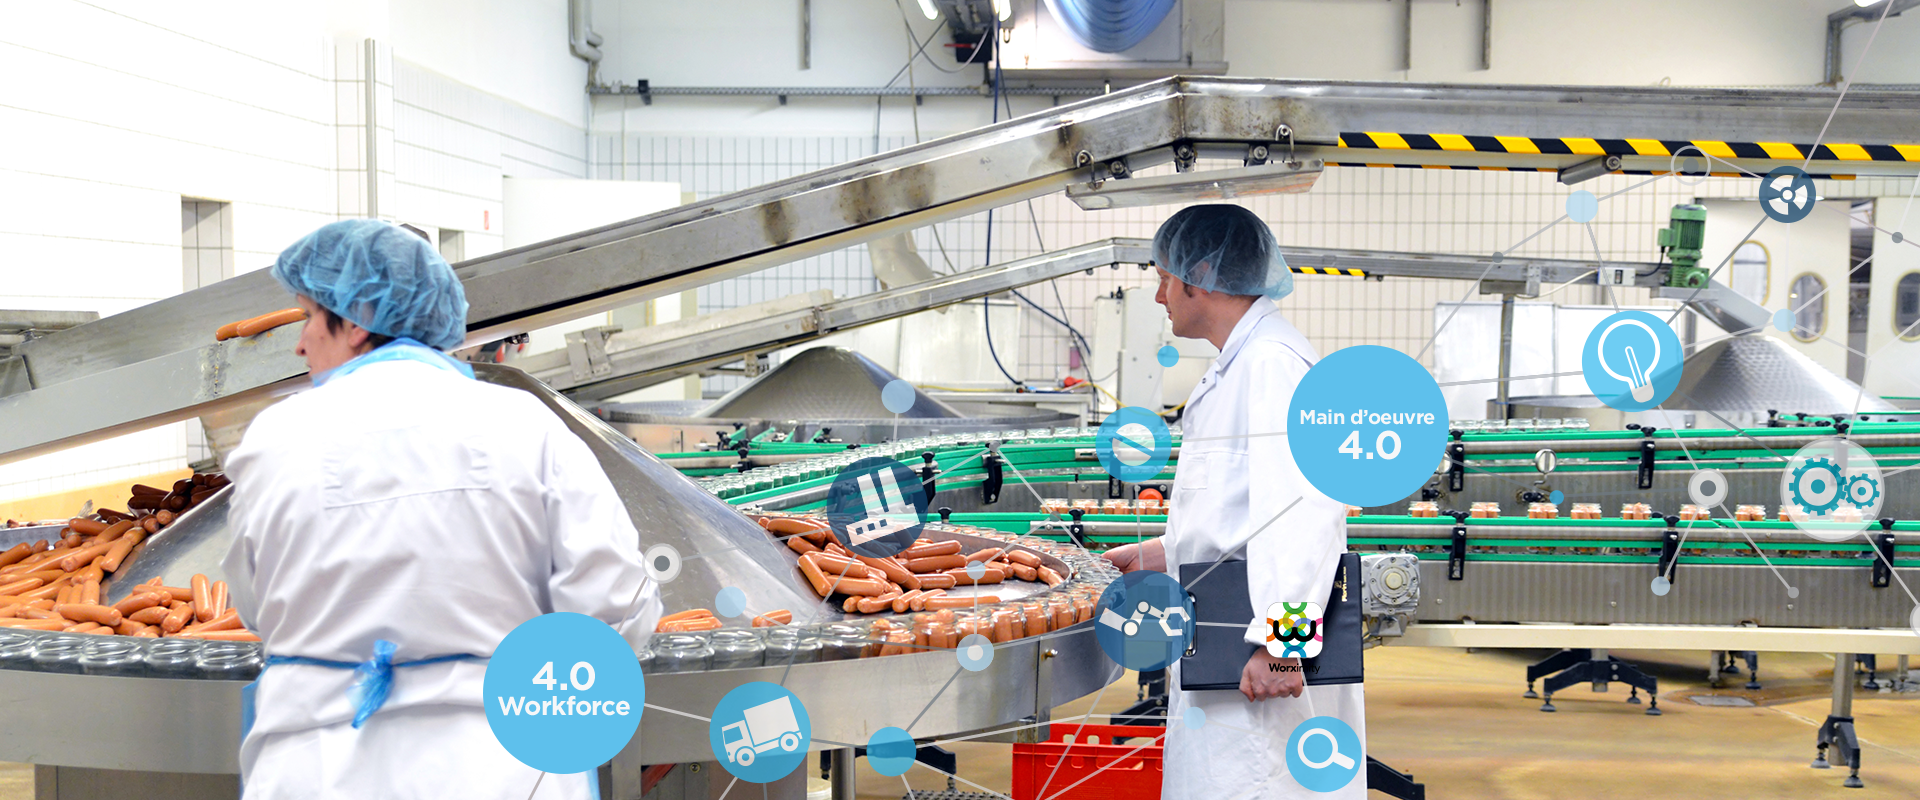
This case study based on the Voltigeurs Poultry Farm experience sheds light on how to achieve increased productivity, yield and profitability as a smart factory using TileBoard.

Learn about how to gain real time production insights and schedule a discovery call with a Worximity expert. Find out how to implement the process in your food and beverage factory.


Did you read all of the posts in our 5-part series? If not, you can easily access them by clicking here:

>>> KPI #1 - Downtime

>>> KPI #2 - Rejects Identified by Metal Detectors 

>>> KPI #3 - Meat Temperature

>>> KPI #4 - Yield

>>> KPI #5 - Overproduction (giveaway)

Want to learn more?
Download the ebook
Related blog articles

Related articles

Back to the blog
Thank you! Your submission has been received!
Oops! Something went wrong while submitting the form.
4
Mar 2019

À la recherche d'une solution à la pénurie de main-d'oeuvre?

French
30
Mar 2020

Industrie 4.0 - moteur de changement dans l'industrie manufacturière et les opérations

French
2
Jul 2019

Réussir dans l'Industrie 4.0 avec le leadership agile

French

Related articles

Back to the blog
Thank you! Your submission has been received!
Oops! Something went wrong while submitting the form.
17
Jun 2024

Mastering the Throughput Formula to Efficiently Calculate Throughput Rate

Dive into throughput rate calculations in manufacturing with Worximity. Maximize production efficiency with our easy-to-follow throughput formula.

English
13
Aug 2021

How to Determine OEE Benchmark Data for Your Factory

Read on to find out how to track your OEE benchmark data, so you can identify opportunities for improvement and track results.

English
17
May 2018

Prendre de meilleures décisions grâce à la surveillance des machines

Les manufacturiers peuvent prendre de meilleures décisions dans leur usine intelligente grâce à une surveillance des machines en temps réel qui leur permet de réagir rapidement aux temps d'arrêt, aux écarts de performance et à la demande fluctuante de leurs clients

French