
Overall Equipment Effectiveness (OEE) is a key tool in any lean manufacturing and continuous improvement system. This theory and method were developed in the 1960s by Seiichi Nakajima as an extension of the Japanese Kaizen system. Today, using OEE is considered a best practice in any manufacturing context.
One of OEE's main benefits comes from the fact that it consolidates several KPIs into a single score, giving a view of the overall performance of the plant, a shift, or a specific piece of equipment. This is possible because OEE provides a framework for measuring production time through a percentage score based on the data collected, all driven by three (3) performance indicators.
Download your smart factory 101 e-book
These three (3) performance metrics are:
Quality: The percentage of defective parts produced during a normal cycle.
Performance: The production speed of a part compared to the fastest theoretical speed.
Availability: Downtime (planned or unplanned) during the scheduled production cycle.
Looked at more closely, these performance indicators are a simplified way of expressing the six big losses. What are they? A quality loss includes any reject (whether at startup or during production), a performance loss comes from minor stops or a slow cycle, and an availability loss occurs when there are stops, whether planned or not. By examining production inefficiency at small and large scales, OEE lets manufacturers pinpoint the source of weak spots and then launch targeted improvement projects.
When efficiency is measured using OEE, a score of 100% represents the best theoretical performance (no defects, maximum production speed, and no downtime), while a score of 0% represents a complete plant shutdown (every performance indicator during the production cycle scoring 0%). In reality, of course, a perfect 100% score is impossible, but it is still important to measure the current performance of the process in place against an ideal process to identify improvements that can be made.
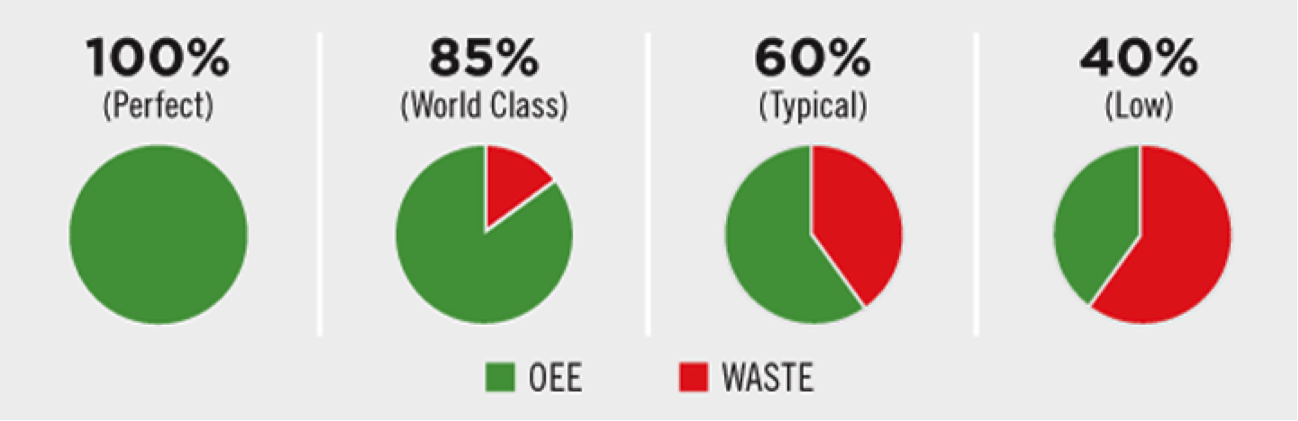
Today, a target of 85% can be set in manufacturing, knowing that the average manufacturer scores around 60%. It therefore makes sense to set a long-term goal of an 85% OEE, which appears to be the highest OEE currently seen in manufacturing. That said, a 40% score is not uncommon either. It often signals a lack of monitoring of performance indicators as part of continuous improvement initiatives.
However, for plants using OEE data to make decisions or implement changes, it is important to note that secondary performance indicators must also be used alongside the KPIs. Take the example of a company wanting to increase production speed based on an ill-conceived plan. You might assume OEE improves, but at the same time this new measure could drive an increase in downtime caused by machinery wear. Even if overall performance improves, a better method should be developed.
Ultimately, every company will adopt its own way of doing things, and there are many ways to express OEE depending on indicator preferences. The key takeaway is that any change will be pointless unless data is collected and stored carefully, diligently, and consistently. With the right structures in place, any manufacturer can use its OEE as a key tool in its continuous improvement journey.
Worximity firmly believes in the merits of continuous improvement philosophies and the lean manufacturing approach in the food and beverage industry. Using our IoT technology, you can get a comprehensive view of your business based on the most relevant statistics for a manufacturer and accelerate the time-to-value of your investments in company culture and training to achieve outstanding productivity.
Discover our platform in this short video or book a meeting with an expert now.