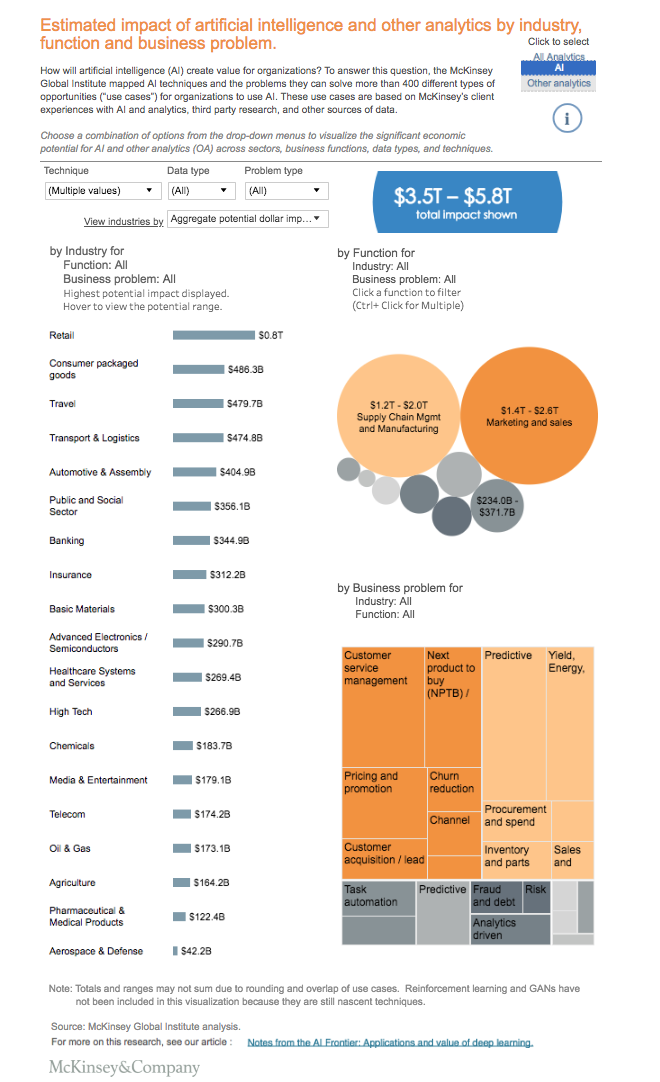
5/6/18

Visualize the uses of AI and analytics with this interactive tool

McKinsey's interactive data visualization shows the potential value created by artificial intelligence and other analytics techniques for 19 industries and nine business functions.

Artificial Intelligence
Visualize the uses of AI and analytics with this interactive tool

Related articles

Back to the blog
Thank you! Your submission has been received!
Oops! Something went wrong while submitting the form.
19
Dec 2018

Food Manufacturing 4.0: The Proof is in the Data

English
22
Jan 2019

Will Robot Butchers Replace the Human Workforce? A Deeper Look Into Australia's Meat Industry

English
17
Jan 2019

Alibaba Cloud Revolutionizes the Meat Industry with AI-driven System

English

Related articles

Back to the blog
Thank you! Your submission has been received!
Oops! Something went wrong while submitting the form.
3
Aug 2018

W. Edwards Deming’s 14 Points: An Introduction

An introduction to W. Edward Deming's 14 Points with Introductions to Lean Manufacturing, Continuous Improvement and IoT.

English
30
Jul 2018

An Introduction to VSM - Value Stream Mapping

VSM is a simple yet incredibly effective way to produce business value. Learn the basics here and how it integrates with IIOT.

English
20
Aug 2021

3 Questions Food Processing Companies Should Ask to Always Identify the Best Improvement Opportunities

Here are three areas food processing companies should focus on to find improvement opportunities.

English