The global poultry market keeps growing, in Canada and worldwide.
This excellent protein source is appealing both environmentally and economically. With that in mind, demand for poultry is increasing and the opening of the global market is driving significant growth forecasts.
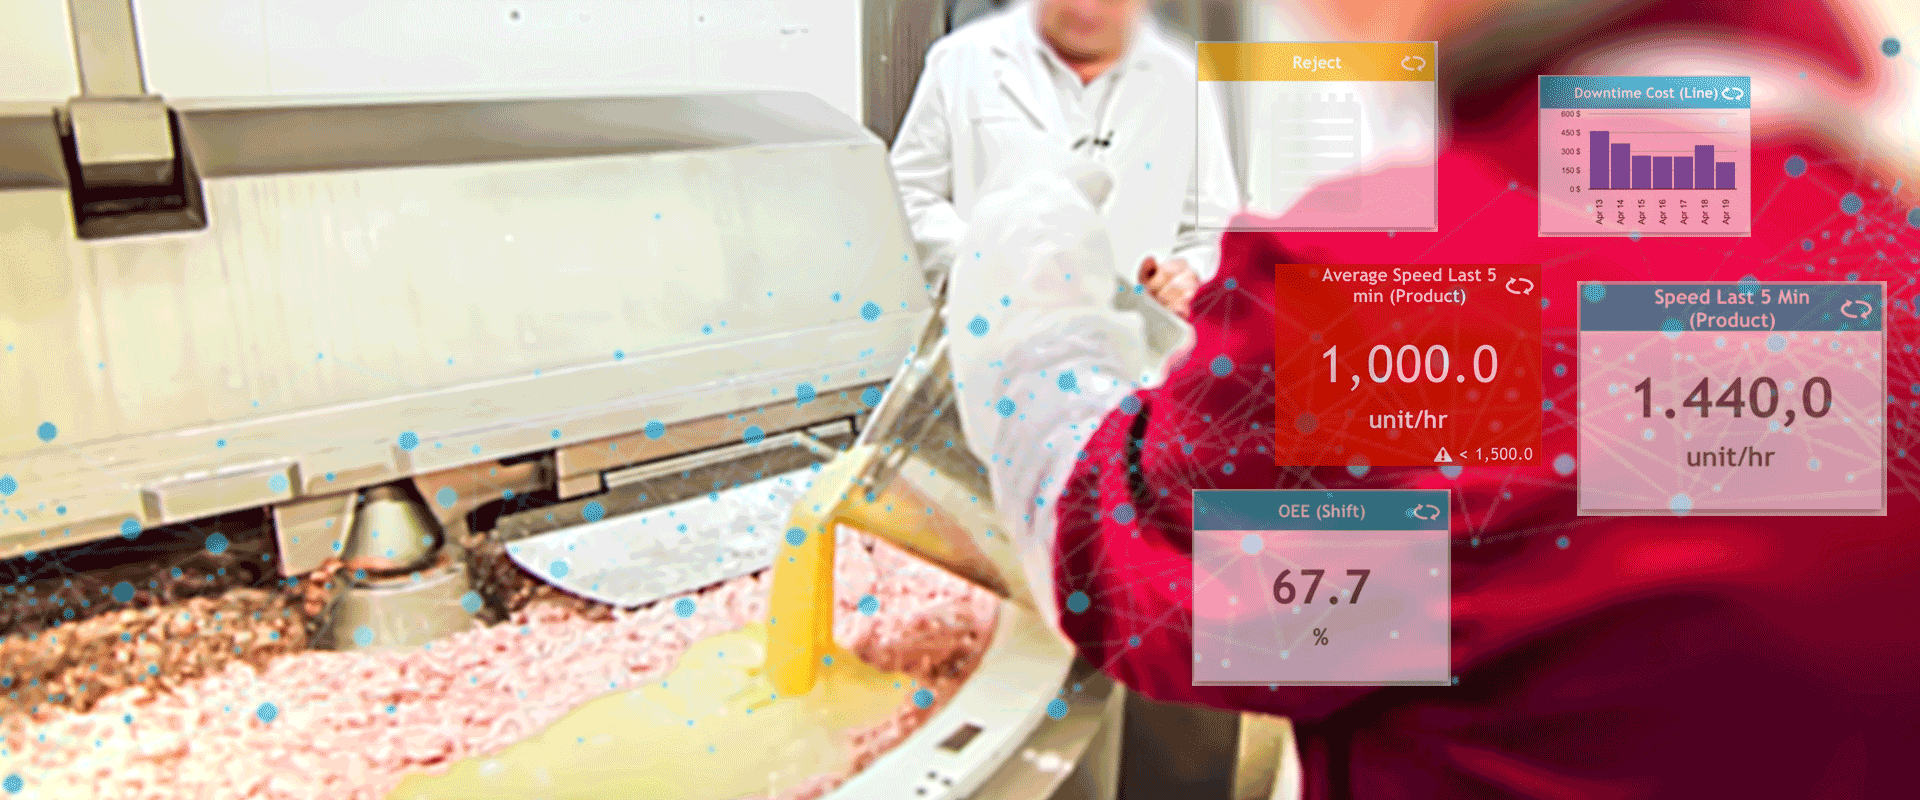
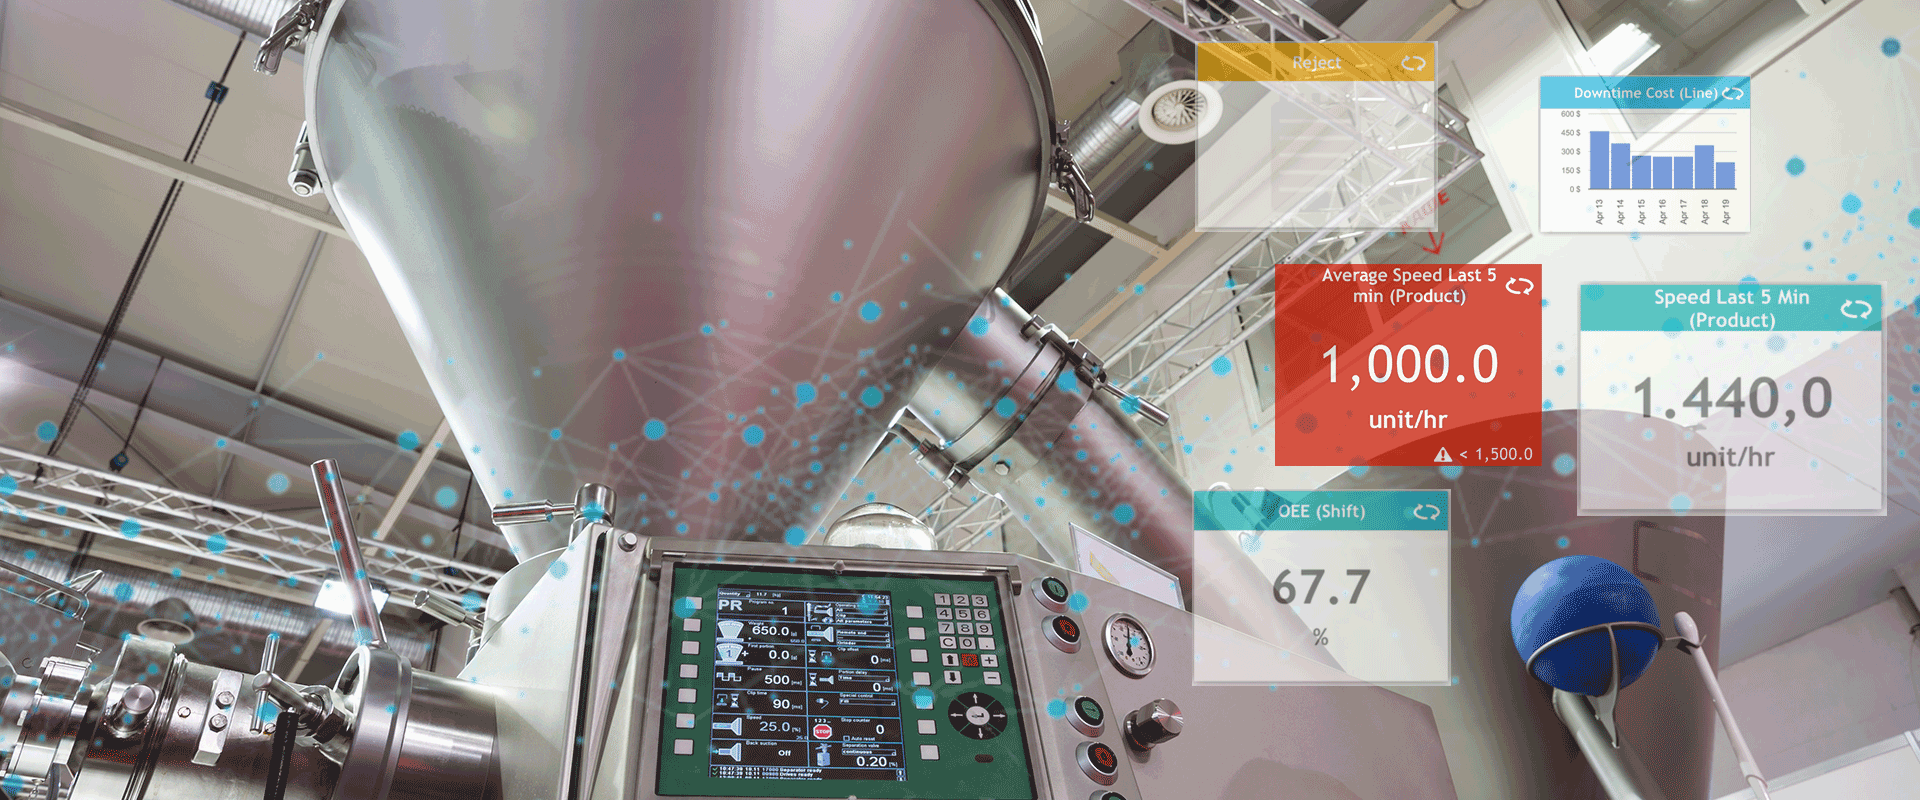
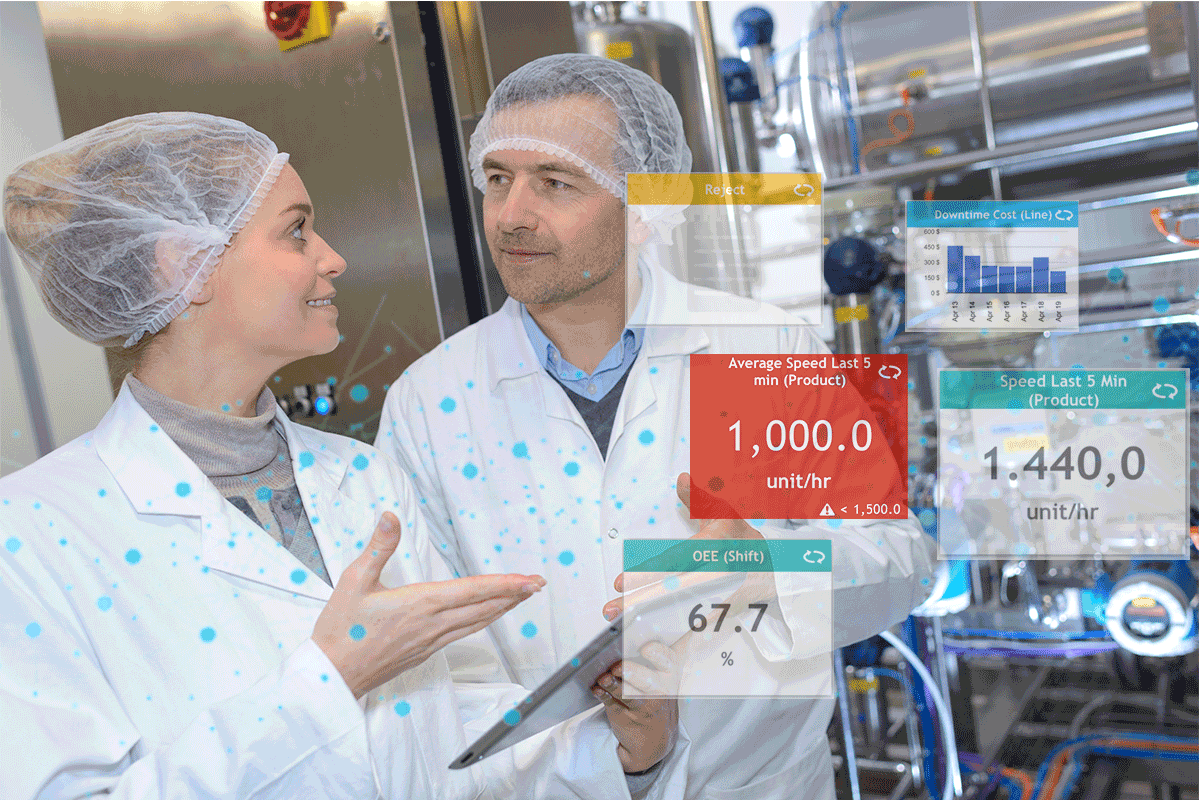
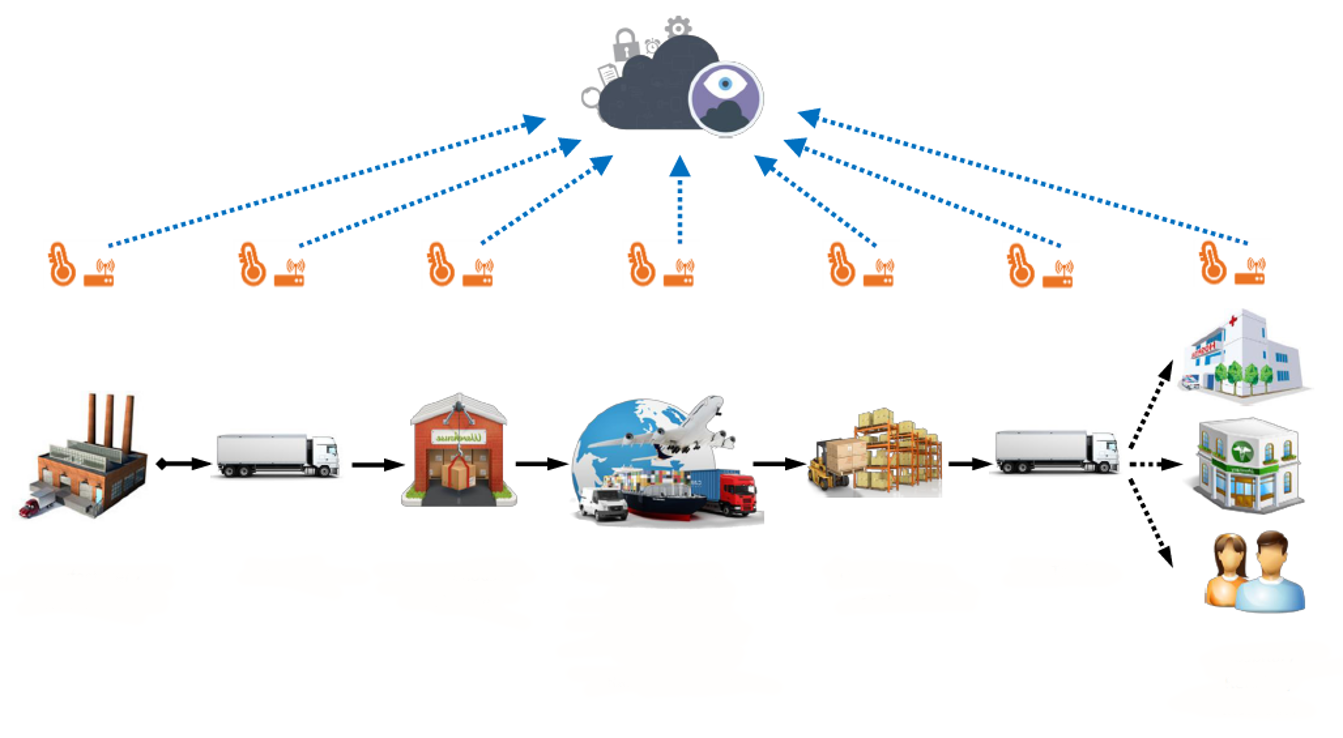
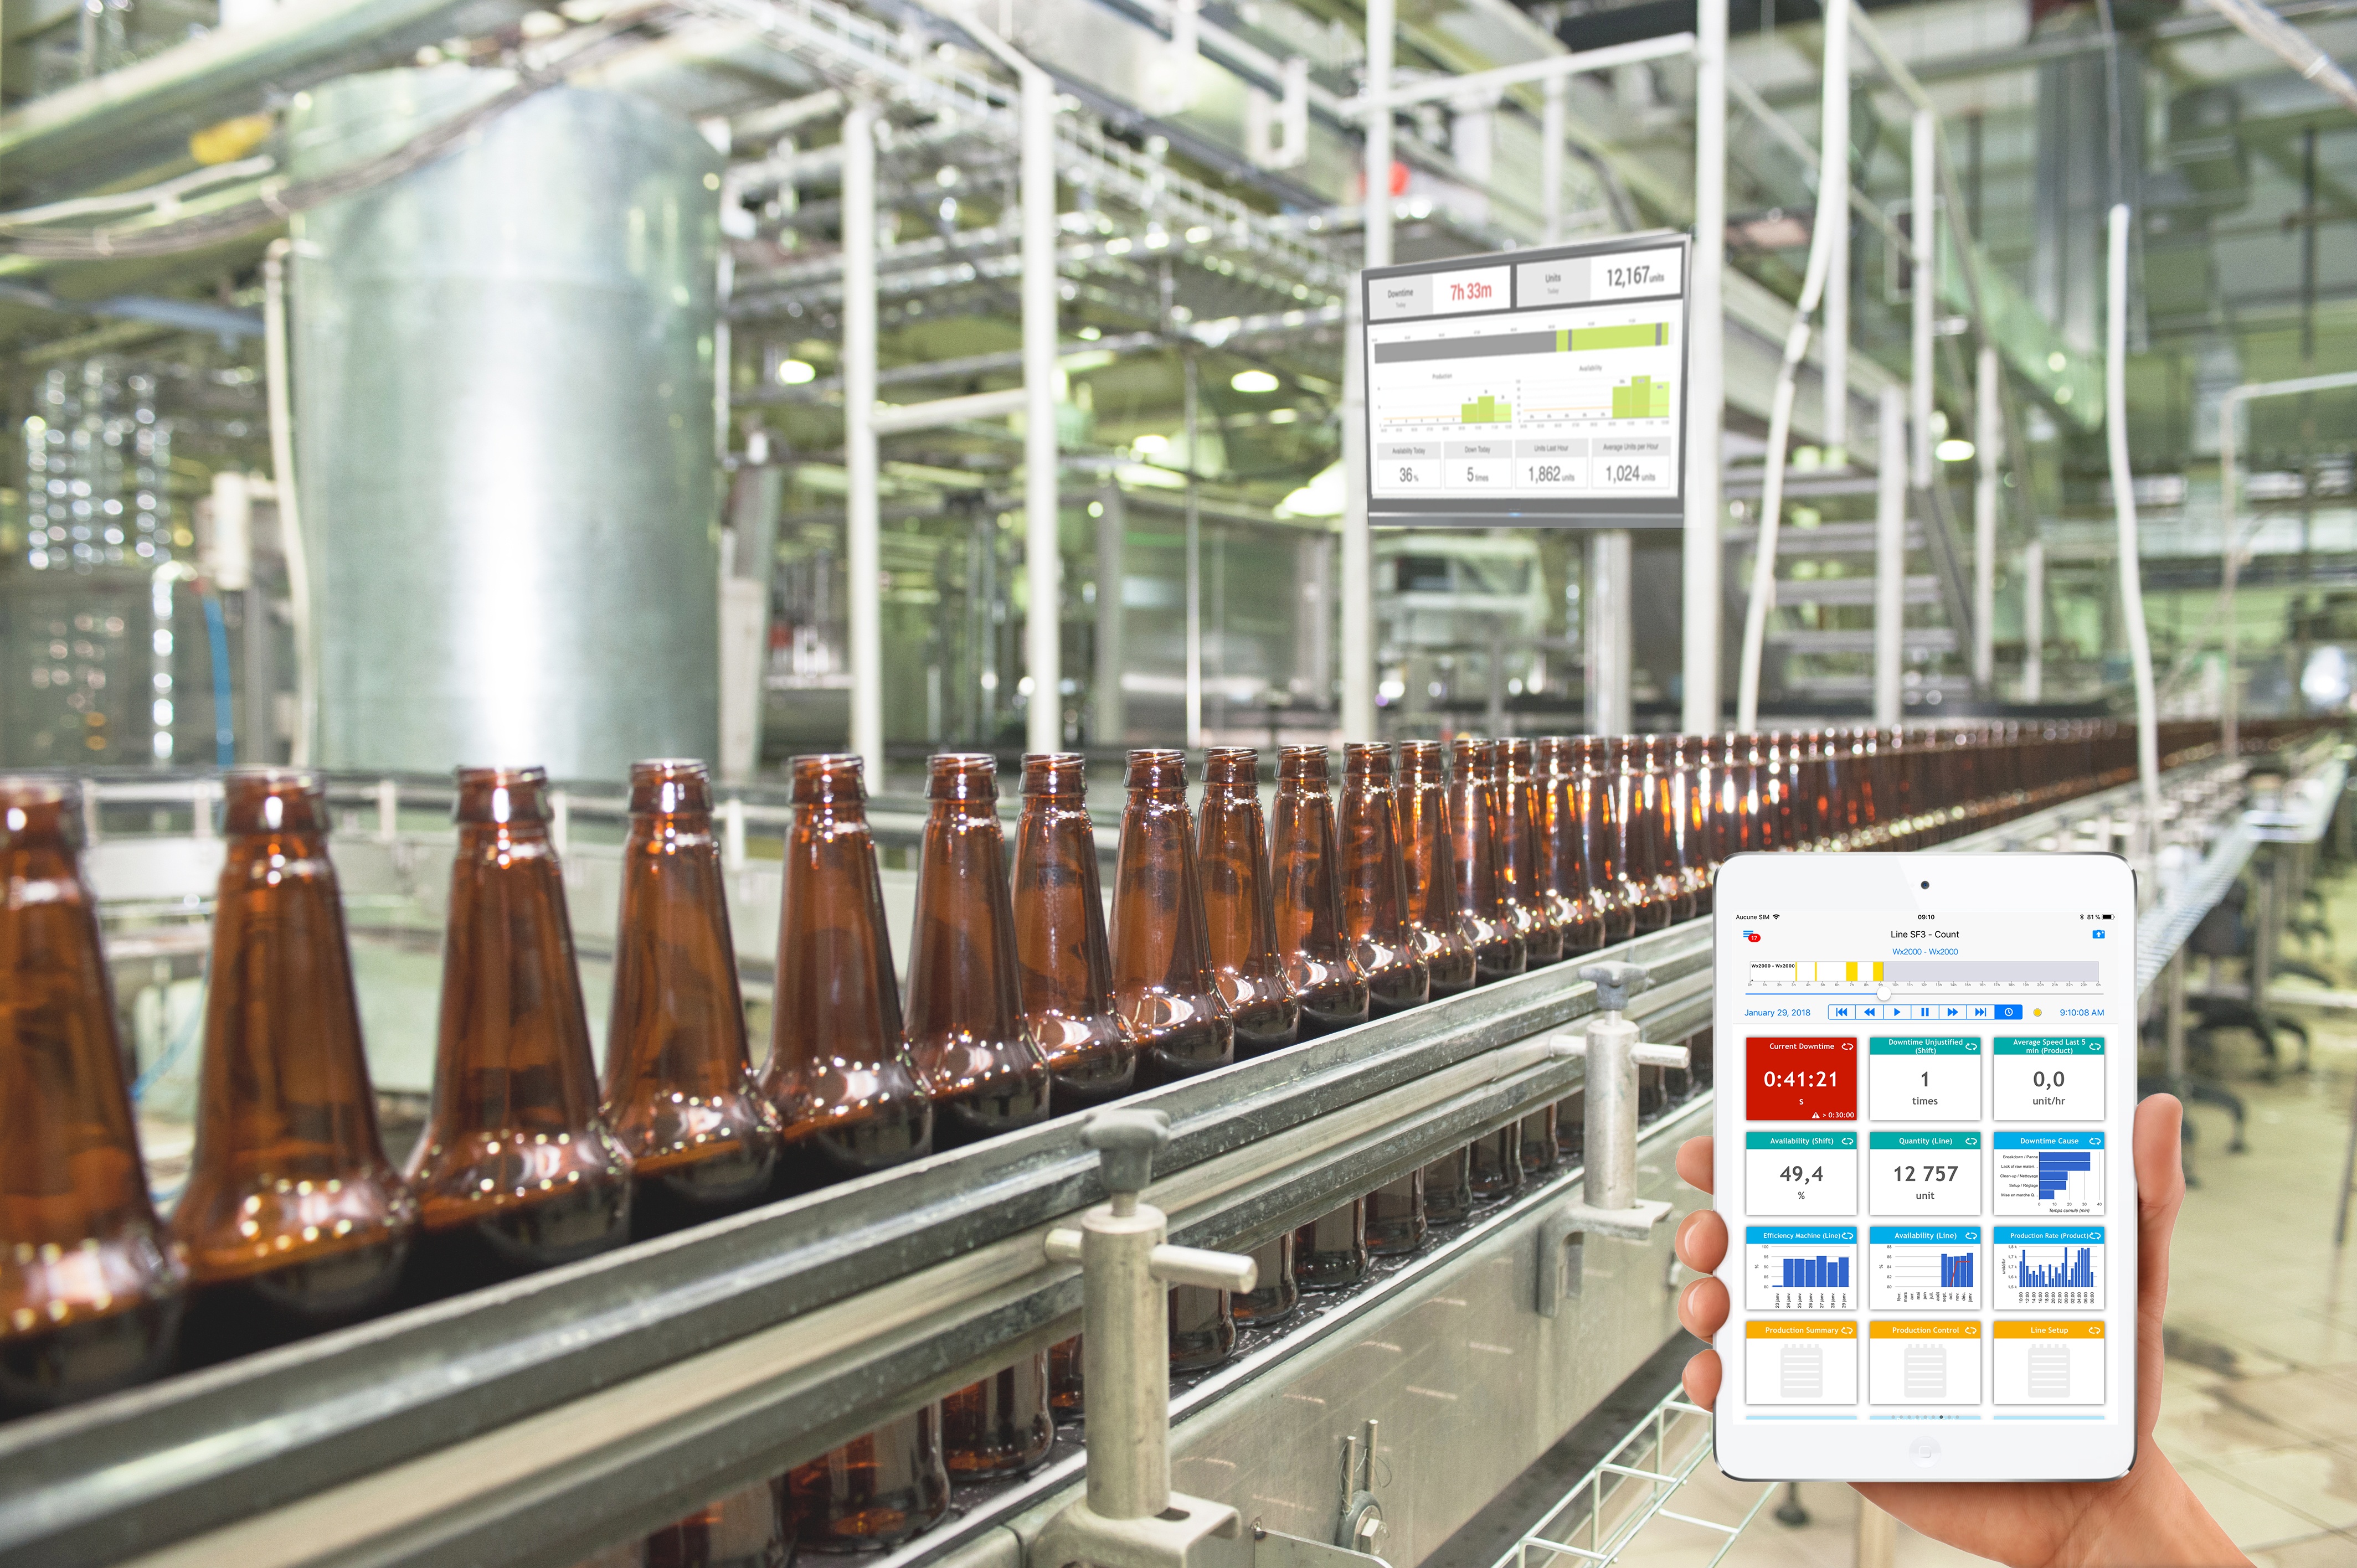
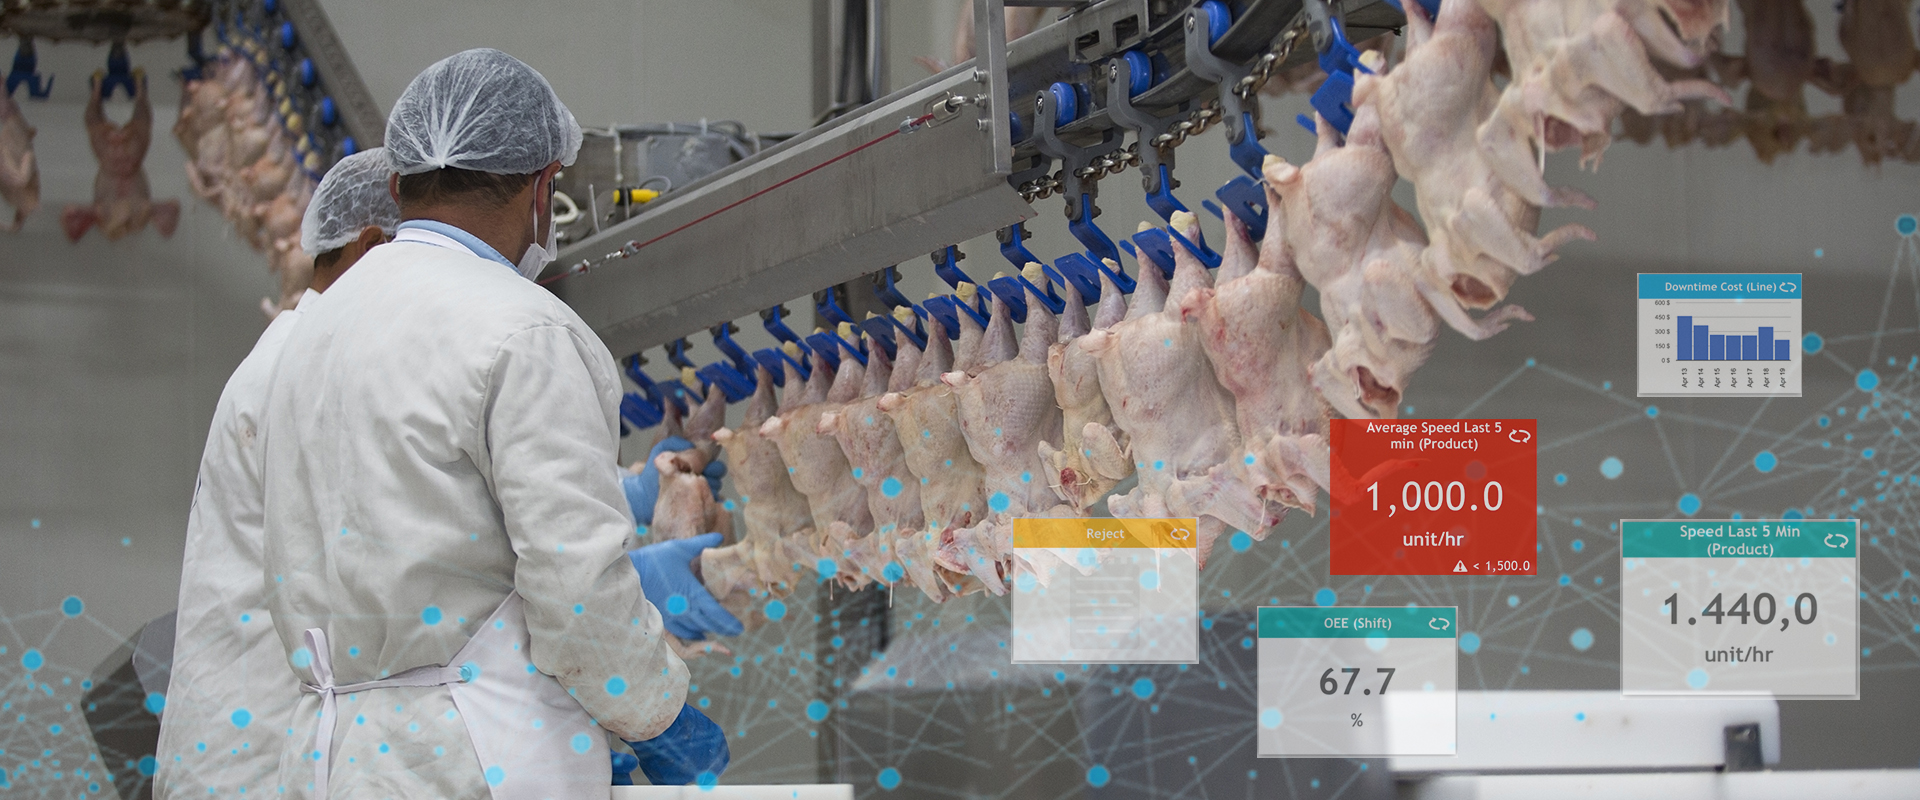
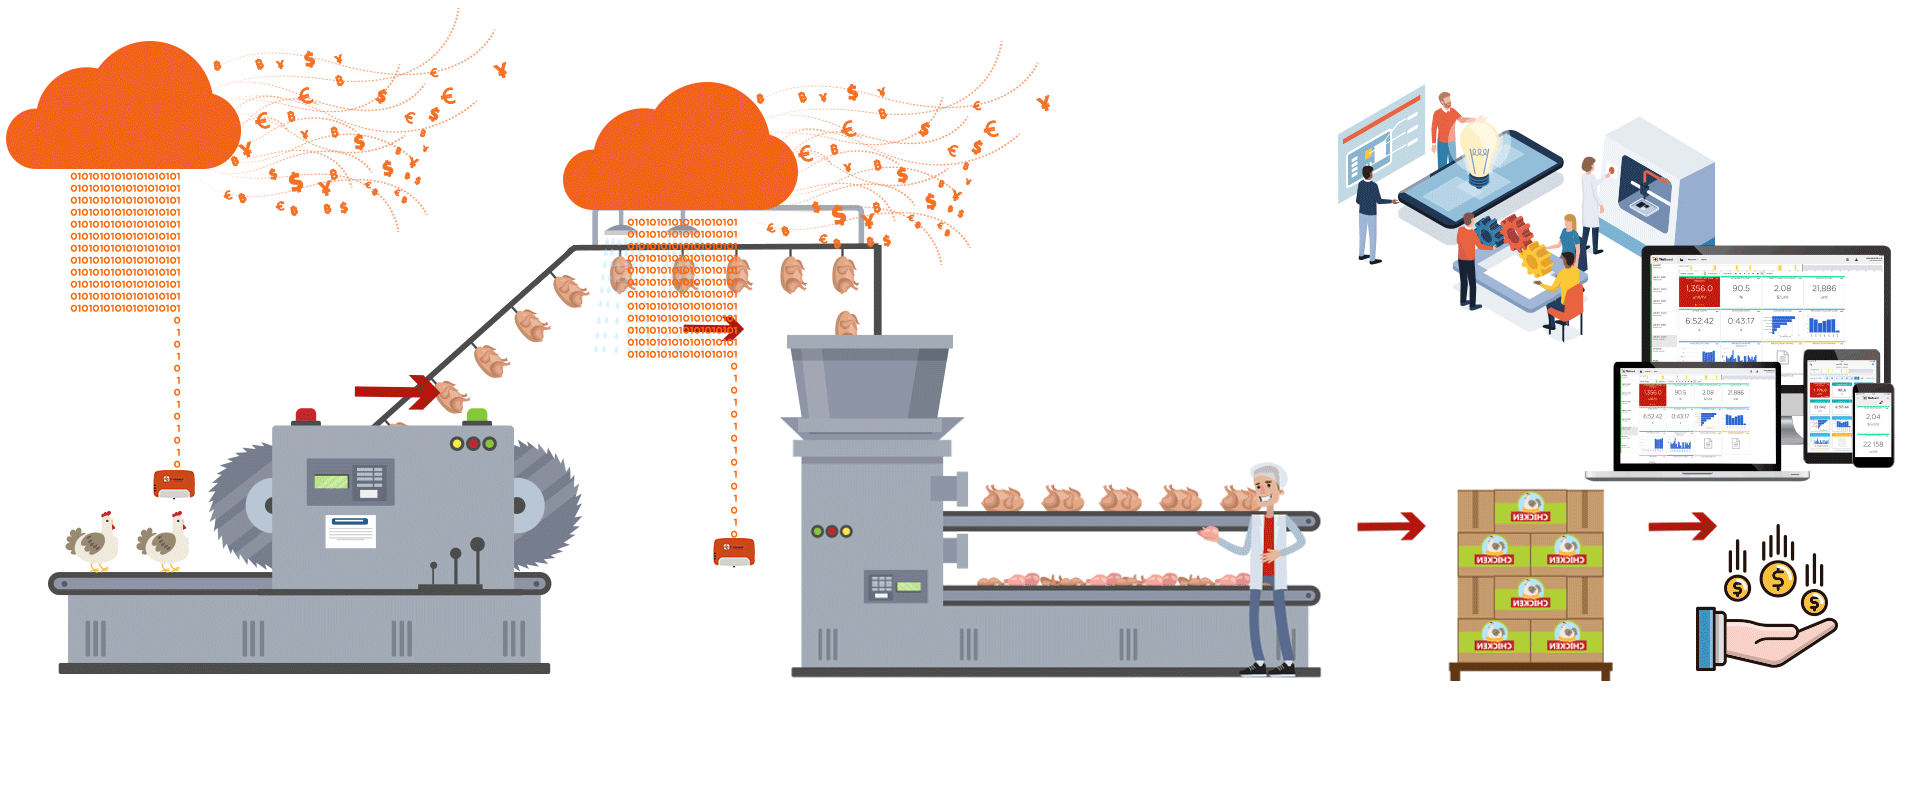
This growth puts pressure on poultry processors. They must continually improve their efficiency and optimize yield. One way to achieve this is by integrating technologies like TileBoard. TileBoard makes it possible to track production in real time and to know production data across the following stages of poultry processing.
What do poultry processors monitor?
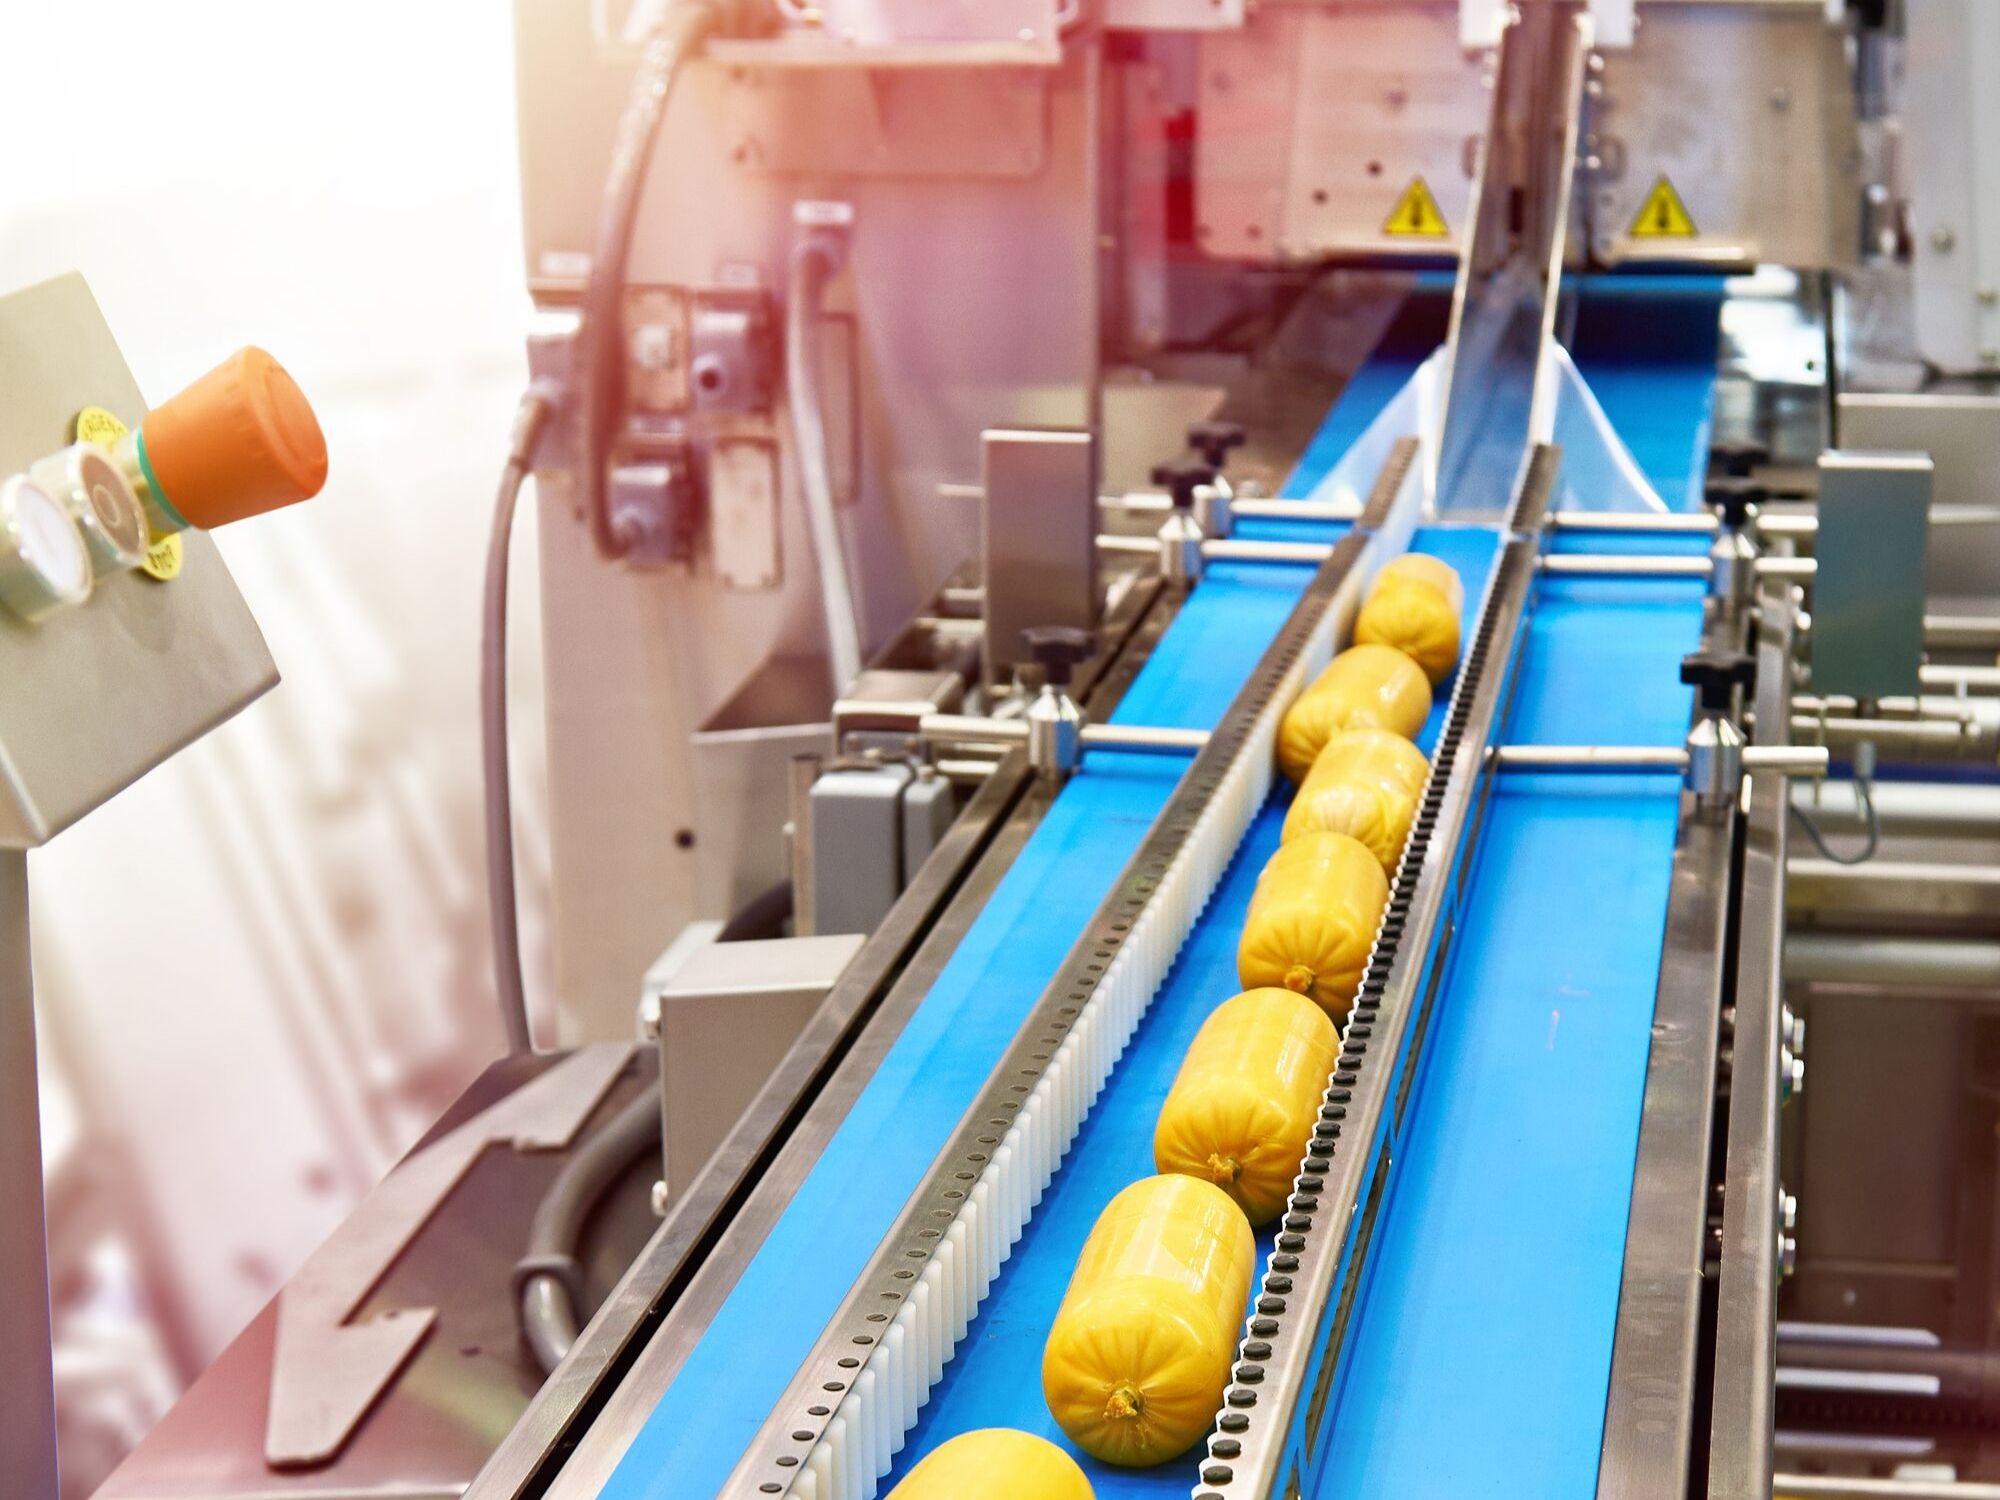
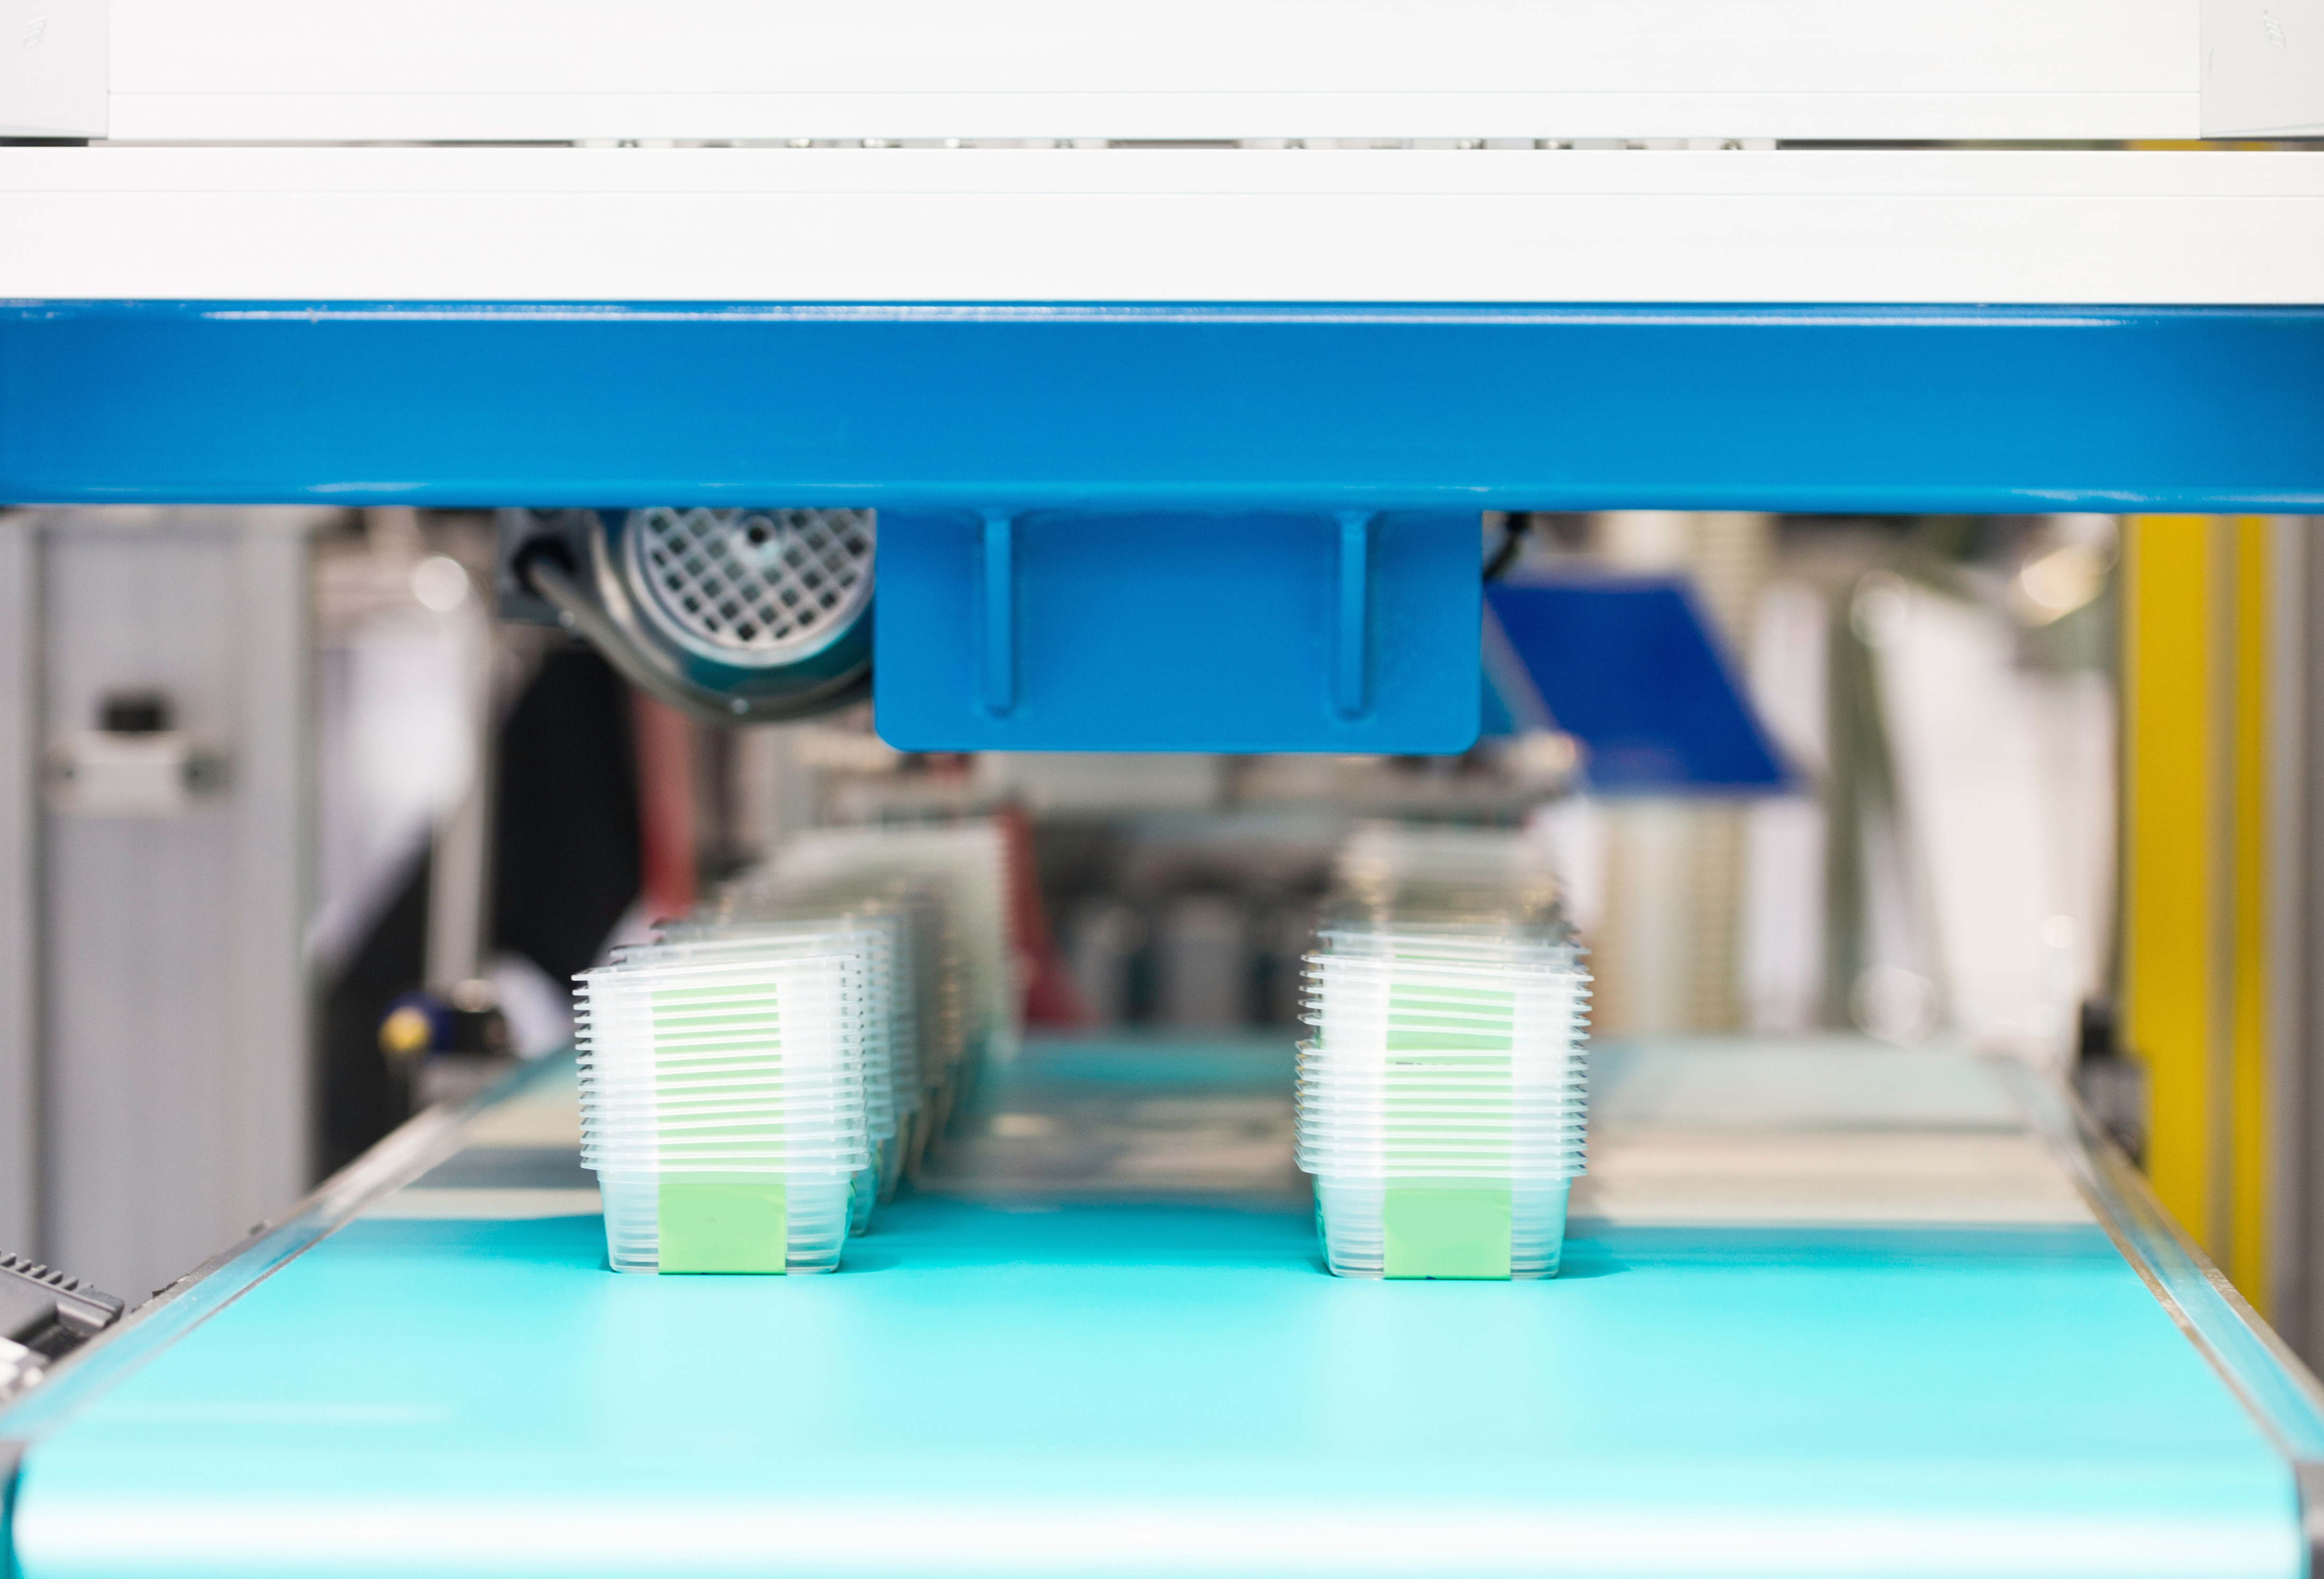
Many of our customers operating in the poultry processing industry monitor different stages of their production: slaughter, gutting, deboning, cutting, portioning, injection, packaging and labeling with our TileConnect sensors and our TileBoard software.
What are the key performance indicators?
A dashboard-style software that tracks production in real time can be a powerful tool to optimize poultry processing operations. The most important KPIs for poultry processors are:
- KPI 1 – Production rate at cutting and deboning per employee
- KPI 2 – Downtime (shift)
- KPI 3 – Average speed last 5 minutes (product)
- KPI 4 – Average weight per unit at packaging
- KPI 5 - Yield
How big is the poultry industry in Canada?
In 2016, retail chicken purchases totaled approximately 698 million kilograms, or 59% of total chicken availability. Quick-service restaurants accounted for 280 million kilograms (24%), full-service restaurants for 135 million kilograms (12%), and hotels and other establishments for 64 million kilograms (5%).
In 2017, Canada produced 1.2 billion kilograms of chicken (eviscerated weight), of which 60.7% came from Quebec and Ontario. The average chicken availability for consumption in 2017 was 33.1 kilograms per person. During that same year, 134.1 million kilograms of chicken meat and edible chicken by-products (fresh, chilled or frozen) were exported to 44 countries for a total value of $441.1 million. The largest importers were the United States, the Philippines and Taiwan. Other countries included Hong Kong, South Africa, Cuba and Jamaica.