
In 2012, there were 722 seafood processing establishments in Canada, most of them located in Nova Scotia (188), Newfoundland and Labrador (148), British Columbia (137) and New Brunswick (83).
During 2012, the sector generated revenues of $4.3 billion and employed more than 33,000 people. The industry is a net exporter of fish and seafood, with exports of $3.5 billion and imports of $2.7 billion. About 70% of total Canadian fish and seafood production is exported.
Most Canadian exports go to the United States (55%), China (11%) and Japan (7%). Canada's main import markets are the United States (23%), China (17%), Thailand (12%) and Vietnam (10%).
What do fish processors monitor?
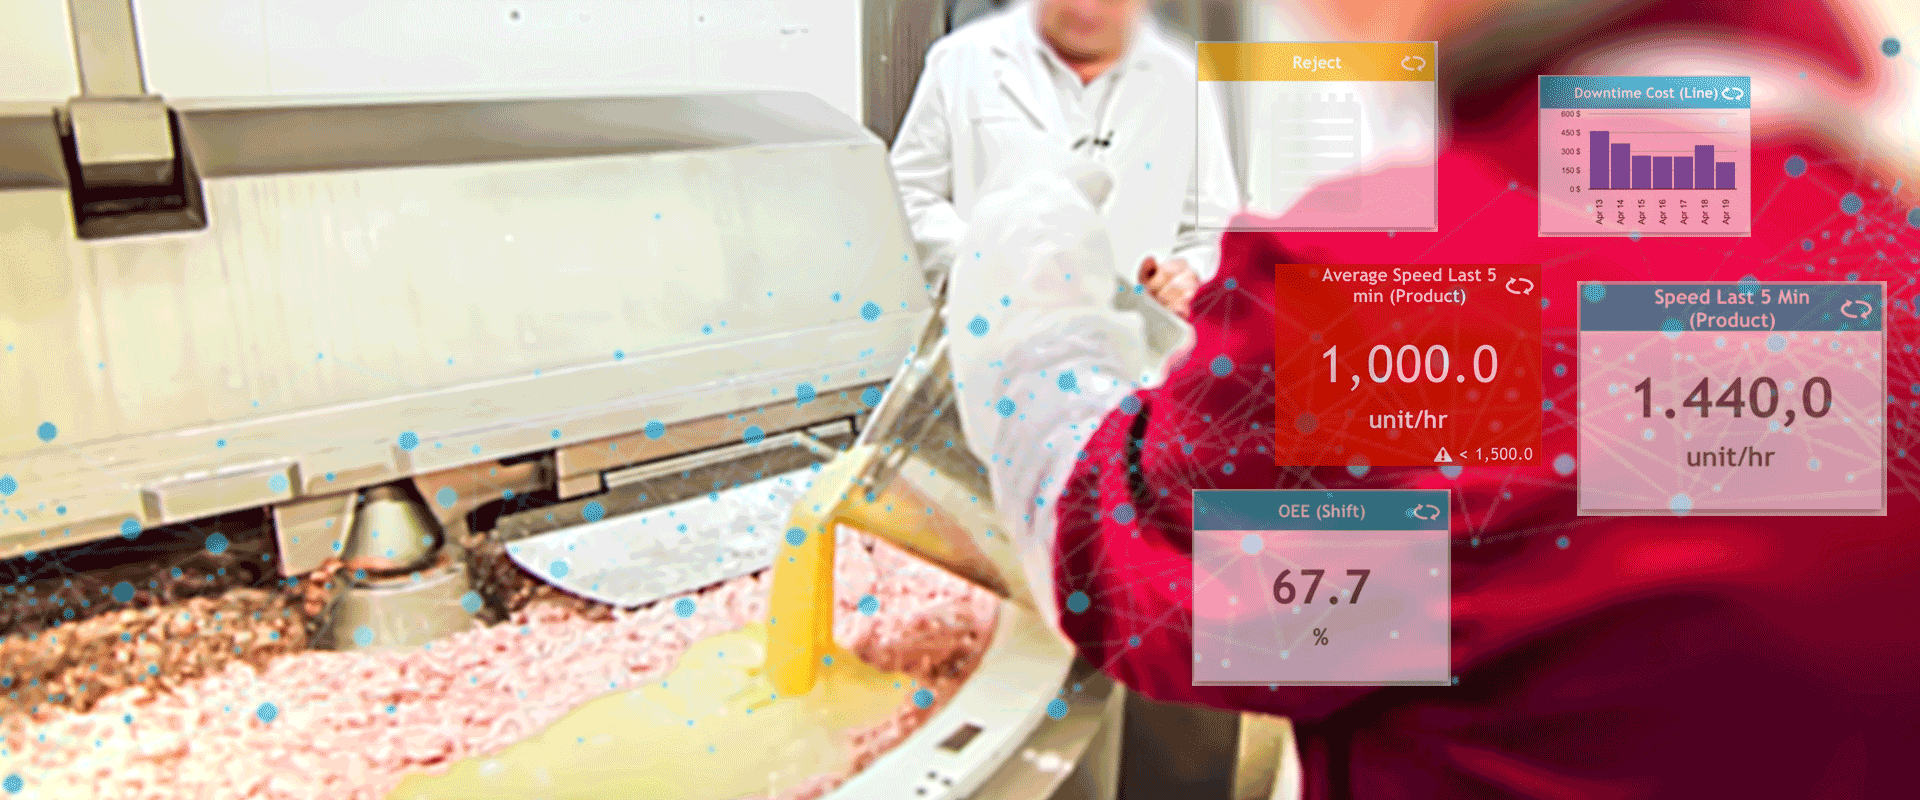
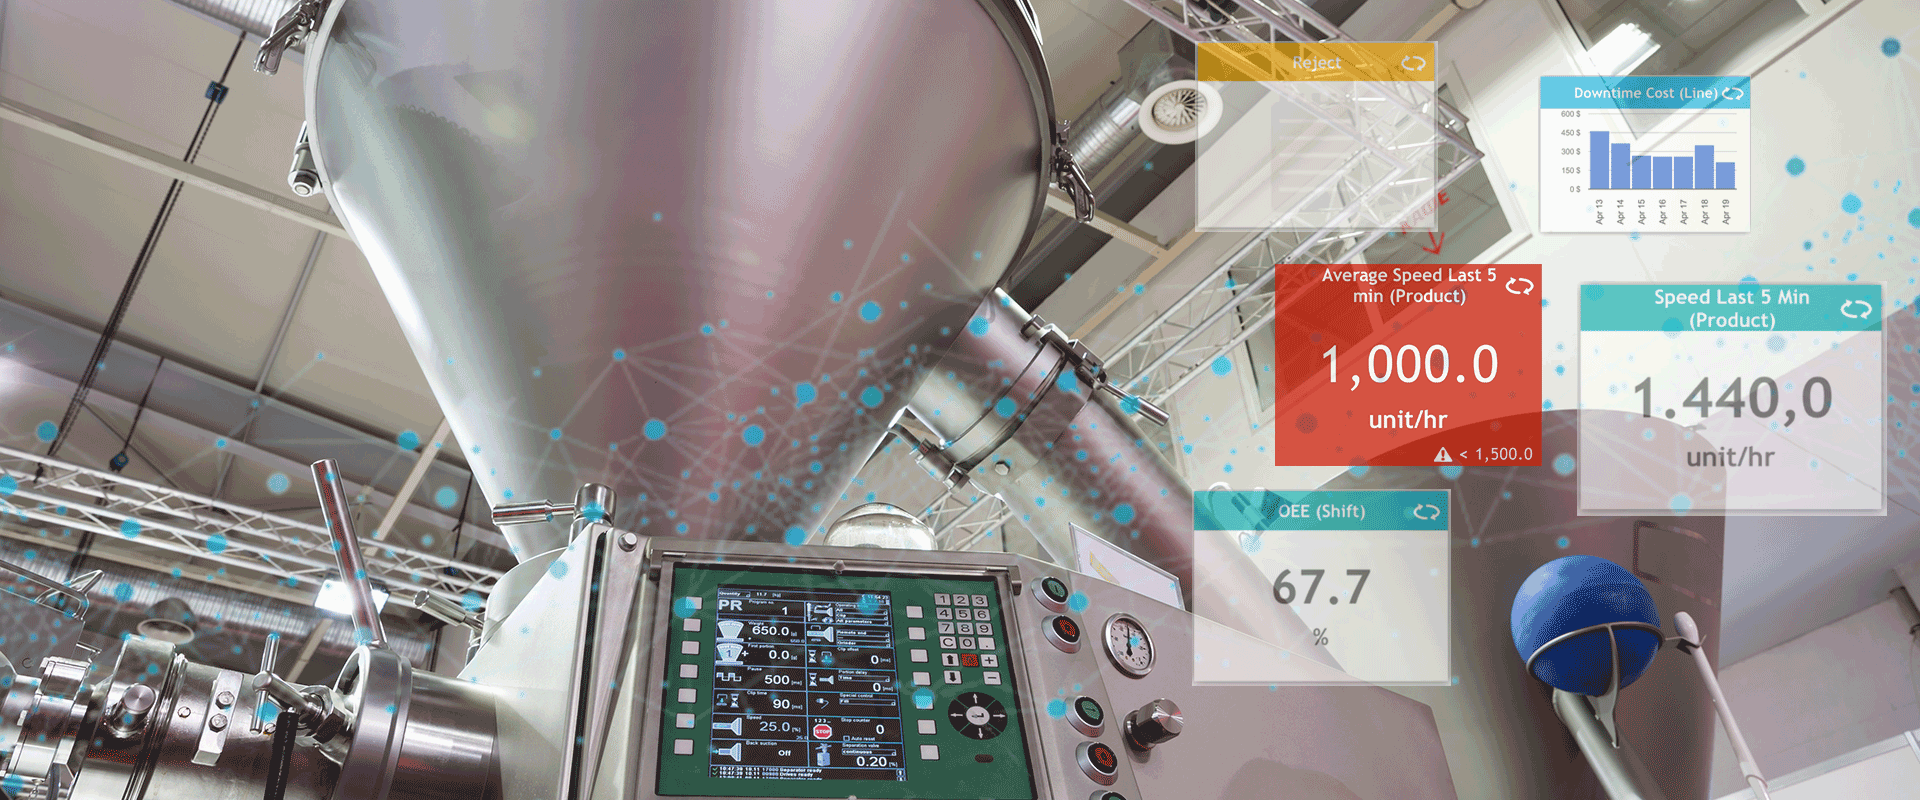
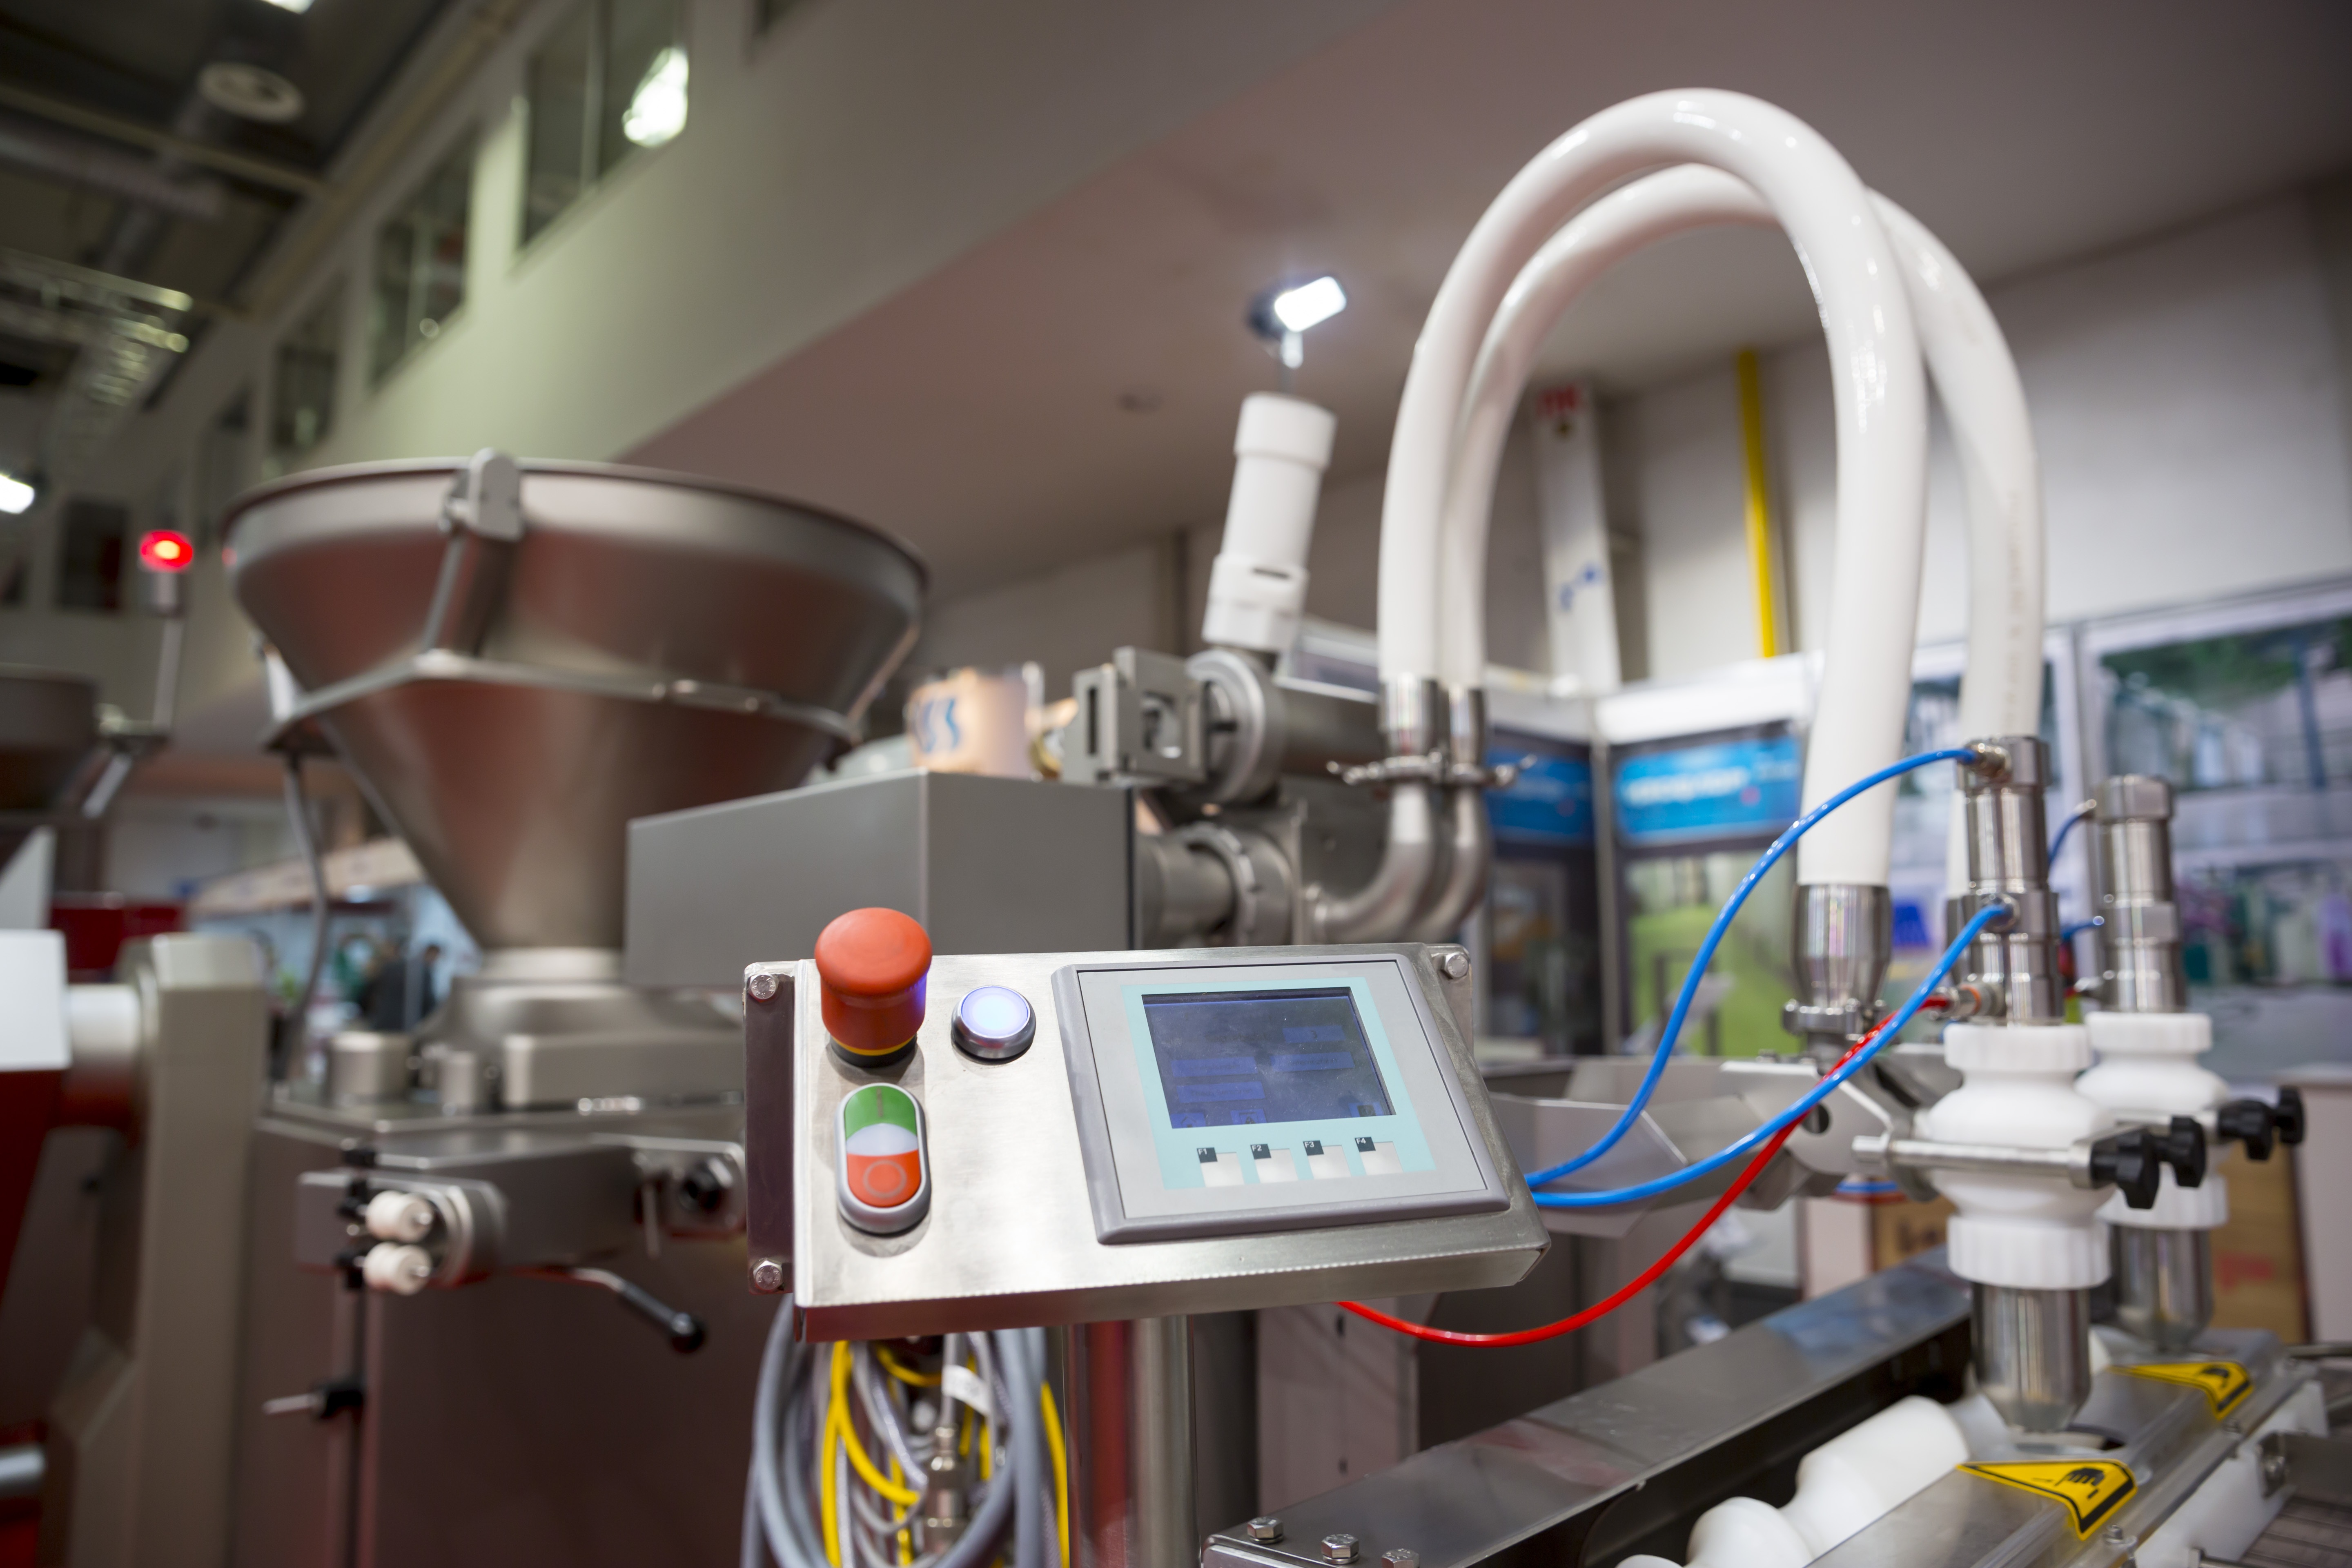
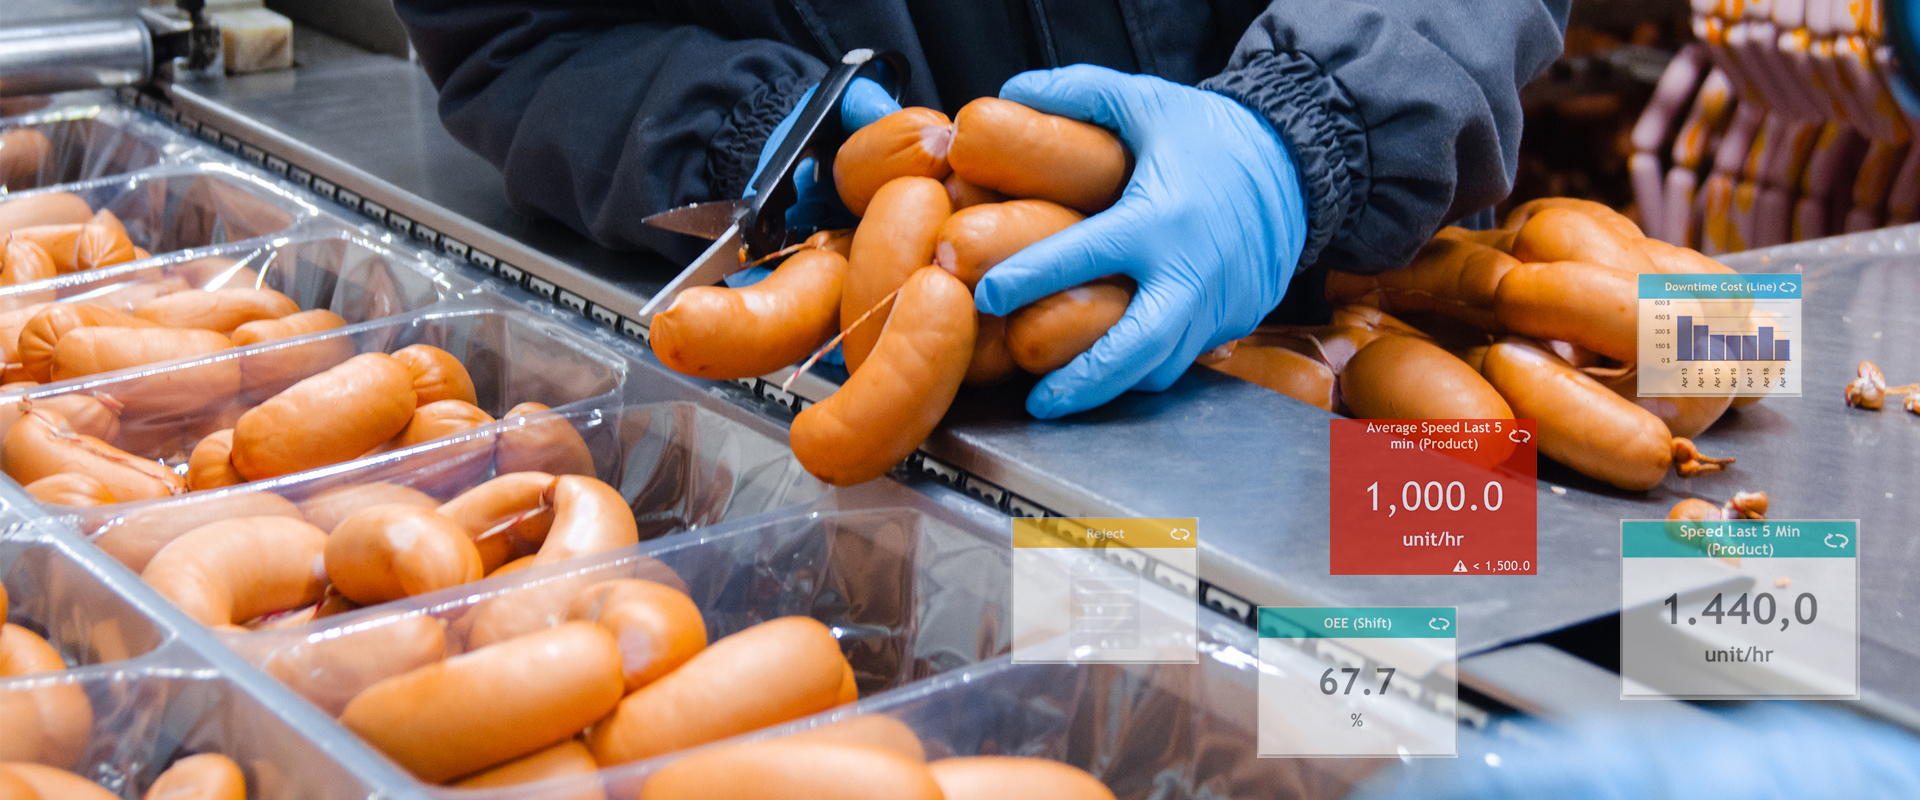
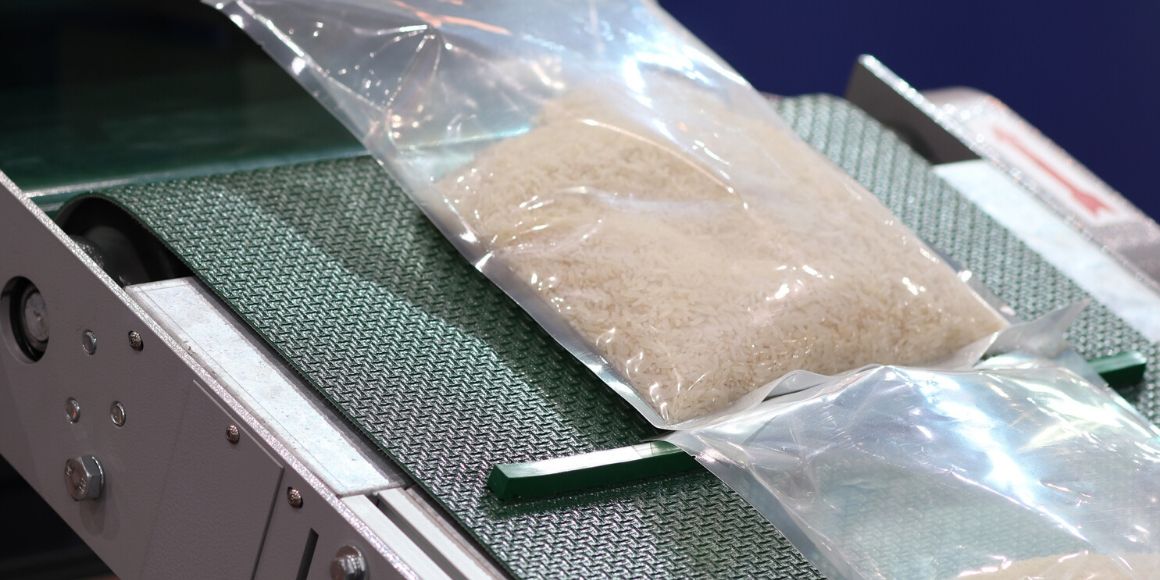
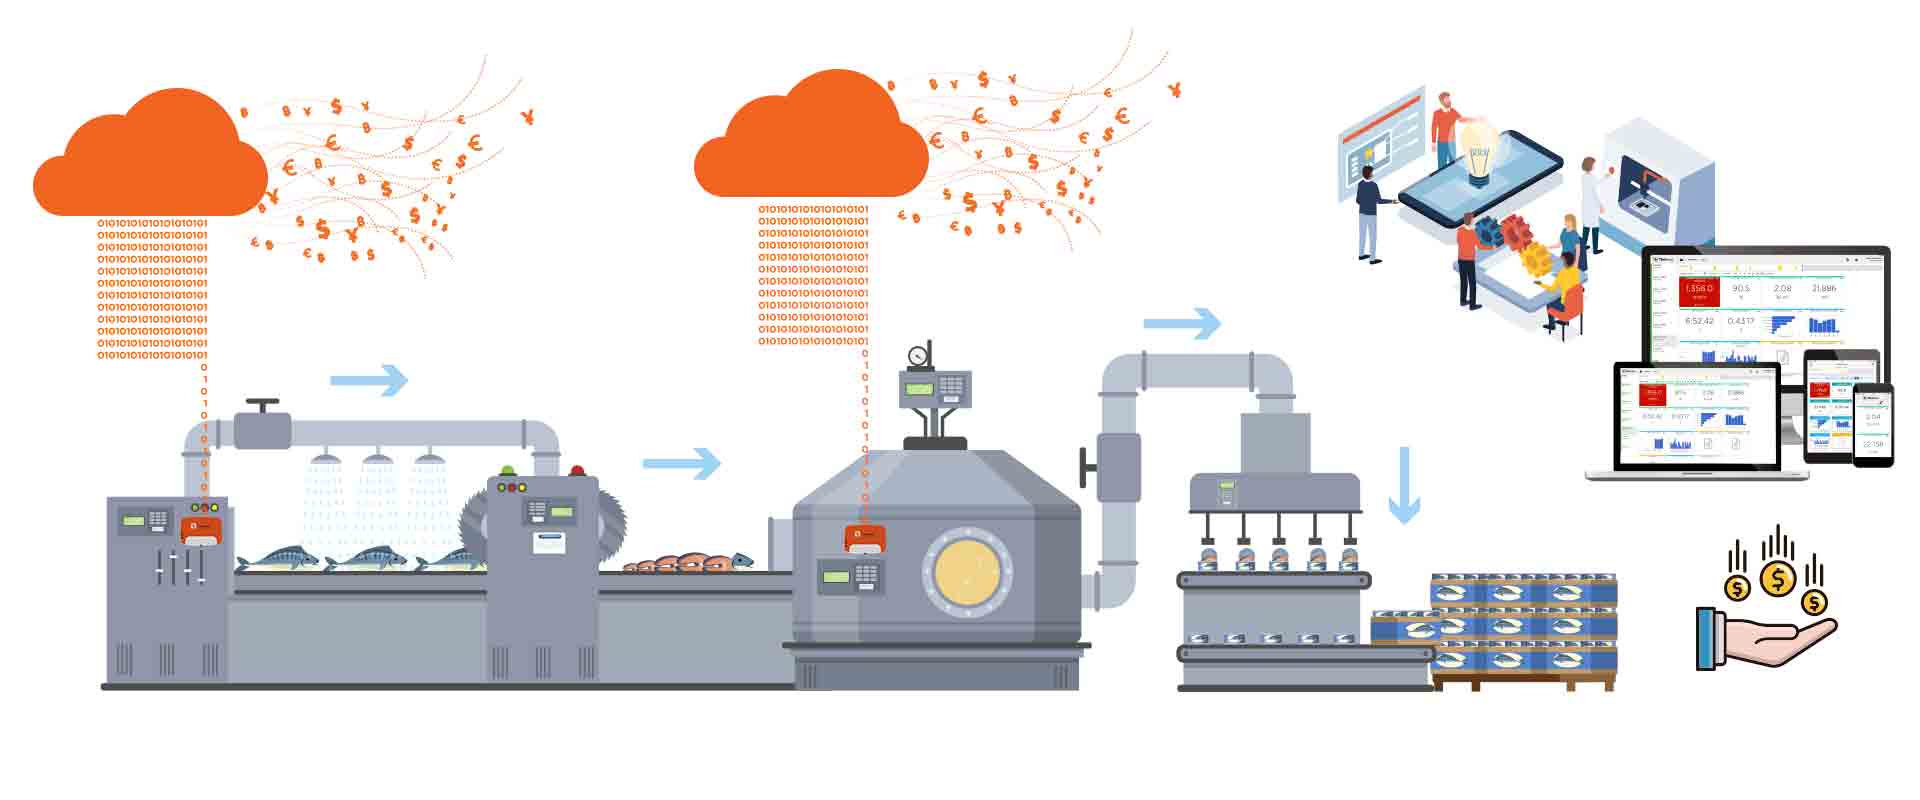
Many of our customers operating in the fish processing industry monitor different stages of their production: gutting, filleting, portioning, injection, seasoning, cooking, packaging and labeling with our TileConnect sensors and our TileBoard software.
What are the key performance indicators?
A dashboard-style software that tracks production in real time can be a powerful tool to optimize operations. The most important KPIs for fish processors are:
- KPI 1 – Availability (shift)
- KPI 2 – Downtime (shift)
- KPI 3 – Quantity produced (shift)
- KPI 4 – Overproduction
- KPI 5 - Yield
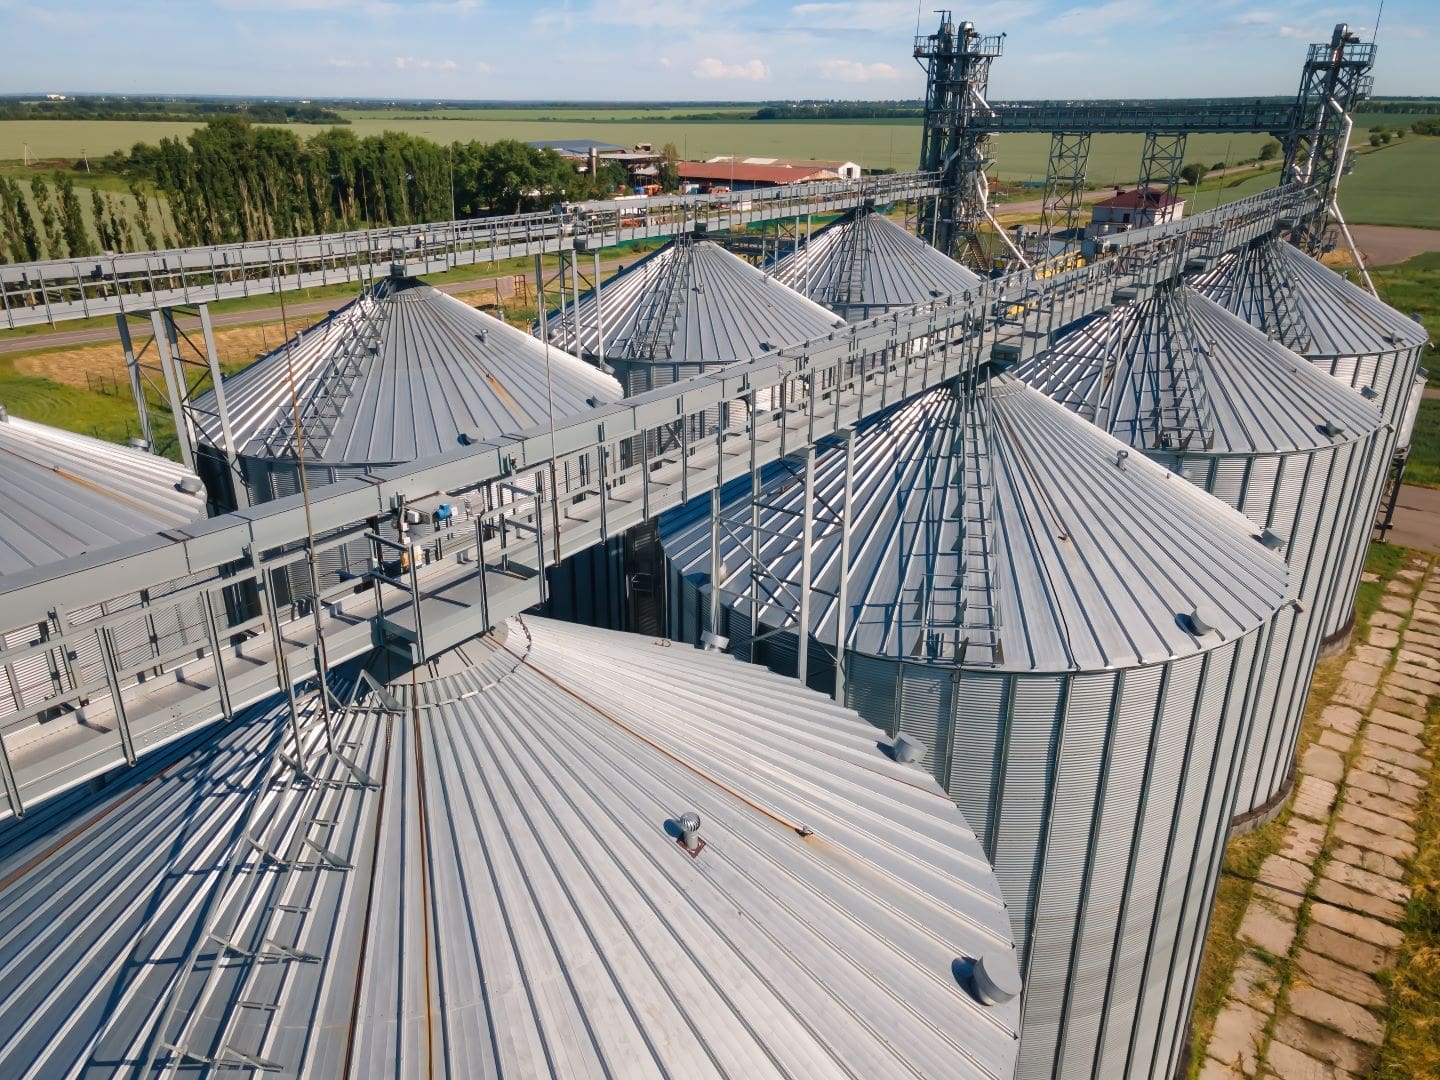
Where does Canadian fish come from?
The industry sources from several regions of Canada. Atlantic and Pacific commercial fisheries are the largest suppliers, followed by aquaculture and freshwater fisheries. Shellfish account for 53% of ocean-caught harvests; pelagic fish (e.g., salmon and tuna), 24%; groundfish (e.g., cod, haddock), 21%. Freshwater fish account for 7% of wild-caught fish, with most coming from lakes in Ontario and Manitoba.