3/10/17

How Baxters Canada Cut the Average Duration of Stoppages

Baxters uses TileBoard and has seen increased uptime and productivity, along with lower direct labor costs.

Smart Factory
How Baxters Canada Cut the Average Duration of Stoppages

Since Baxters started using TileBoard, the company has seen increased uptime and productivity, along with lower direct labor costs.

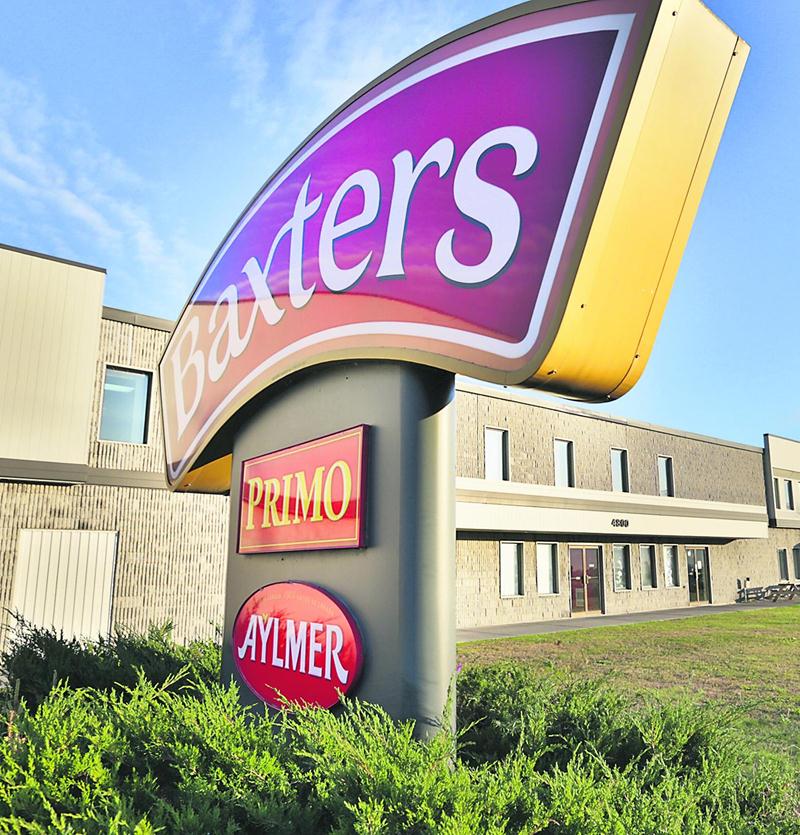
Baxters Canada Inc. is the largest supplier of private-label canned soups in Canada. The company also markets its own brands: Aylmer, Primo and Baxters. Since 1976, it has built deep expertise in manufacturing a wide range of complete meals in flexible pouches. Baxters has been HACCP recognized since 2006 and BRC certified since May 2011. The St-Hyacinthe plant produces more than a hundred soup recipes.

To remain an industry leader, Baxters needed to understand its main downtime causes and monitor the performance of its various products. After only 6 months of TileBoard use, average productivity per hour per employee increased by more than 21%, reaching a 32% improvement after 24 months. Direct labor costs dropped by 18% after 6 months and reached a 30% reduction at 17 months.

Daniel Bolduc, production analyst, and François-David Leblanc, finance director, also saw an 18% increase in uptime and an impressive reduction in the average duration of stoppages, going from 23 minutes per stop to 5 minutes, thanks to increased responsiveness.

These results are not achieved without the effort and involvement of shop-floor employees. See how you can also engage your workforce and become more productive day-to-day with IIoT.

Want to learn more?
Download the ebook
Related blog articles

Related articles

Back to the blog
Thank you! Your submission has been received!
Oops! Something went wrong while submitting the form.
4
Mar 2019

Looking for a solution to the labor shortage?

English
30
Mar 2020

Industry 4.0 — driving change in manufacturing and operations

English
2
Jul 2019

Succeeding in Industry 4.0 with Agile Leadership

English

Related articles

Back to the blog
Thank you! Your submission has been received!
Oops! Something went wrong while submitting the form.
Simple infographic showing a downward arrow for downtime and an upward arrow for throughput, illustrating the relationship between reducing production downtime and increasing manufacturing throughput, efficiency, and operational performance.
17
Oct 2023

Maximizing Uptime: Strategies for Reducing Downtime and Boosting Throughput

Discover expert strategies to maximize uptime and throughput in manufacturing, from reducing changeover times to eliminating bottlenecks and unlocking hidden capacity.

English
Lean manufacturing infographic featuring diagrams, charts, and key performance concepts related to waste reduction, quality improvement, and operational efficiency, illustrating the connection between Lean principles and Overall Equipment Effectiveness.
16
Oct 2023

The Synergy Between Lean Manufacturing and OEE Monitoring

Overall Equipment Effectiveness (OEE) monitoring plays a crucial role in the realm of lean manufacturing, serving as an essential tool to assess and enhance the efficiency and productivity of manufacturing processes.

English
Aerial view of a forest with a digital production icon overlaid on the landscape, symbolizing sustainable manufacturing, environmentally responsible production processes, green operations, and the integration of technology with sustainability.
21
Sep 2023

Smart Manufacturing: It's Not Only Productive, It's Sustainable

Production monitoring technology can serve as a crucial catalyst for manufacturers embarking on their ESG journey.

English