3/10/17

How Baxters Canada Cut the Average Duration of Stoppages

Baxters uses TileBoard and has seen increased uptime and productivity, along with lower direct labor costs.

Smart Factory
How Baxters Canada Cut the Average Duration of Stoppages

Since Baxters started using TileBoard, the company has seen increased uptime and productivity, along with lower direct labor costs.

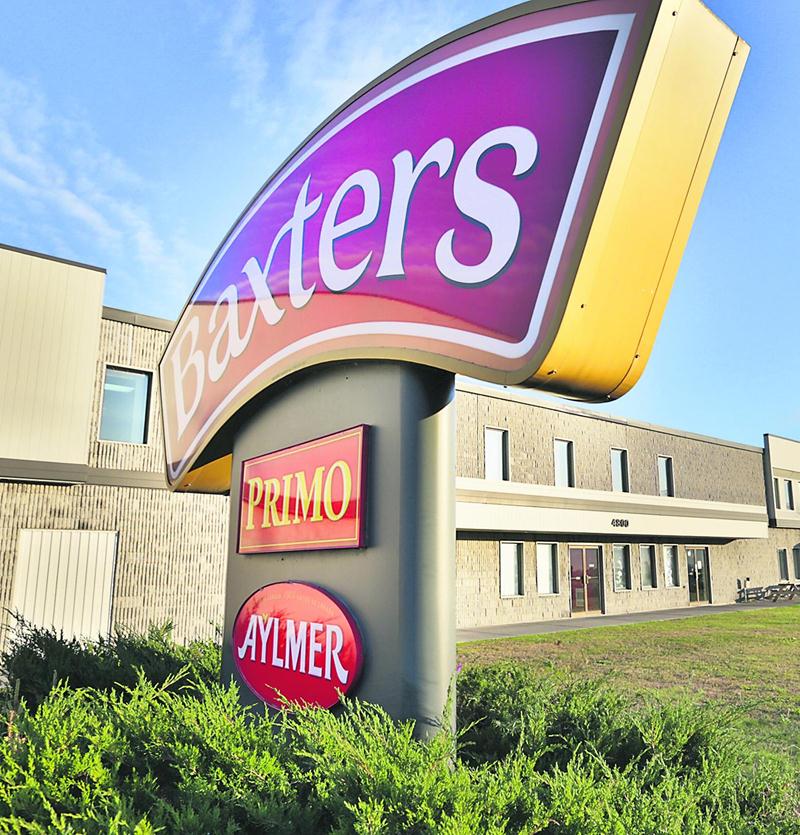
Baxters Canada Inc. is the largest supplier of private-label canned soups in Canada. The company also markets its own brands: Aylmer, Primo and Baxters. Since 1976, it has built deep expertise in manufacturing a wide range of complete meals in flexible pouches. Baxters has been HACCP recognized since 2006 and BRC certified since May 2011. The St-Hyacinthe plant produces more than a hundred soup recipes.

To remain an industry leader, Baxters needed to understand its main downtime causes and monitor the performance of its various products. After only 6 months of TileBoard use, average productivity per hour per employee increased by more than 21%, reaching a 32% improvement after 24 months. Direct labor costs dropped by 18% after 6 months and reached a 30% reduction at 17 months.

Daniel Bolduc, production analyst, and François-David Leblanc, finance director, also saw an 18% increase in uptime and an impressive reduction in the average duration of stoppages, going from 23 minutes per stop to 5 minutes, thanks to increased responsiveness.

These results are not achieved without the effort and involvement of shop-floor employees. See how you can also engage your workforce and become more productive day-to-day with IIoT.

Want to learn more?
Download the ebook
Related blog articles

Related articles

Back to the blog
Thank you! Your submission has been received!
Oops! Something went wrong while submitting the form.
4
Mar 2019

Looking for a solution to the labor shortage?

English
30
Mar 2020

Industry 4.0 — driving change in manufacturing and operations

English
2
Jul 2019

Succeeding in Industry 4.0 with Agile Leadership

English

Related articles

Back to the blog
Thank you! Your submission has been received!
Oops! Something went wrong while submitting the form.
Hand interacting with a futuristic digital interface displaying “2024,” AI icons, and technology symbols, representing emerging technology trends, artificial intelligence, digital transformation, innovation, and future-focused business strategy.
9
Jan 2024

Manufacturing Trends to Lookout for in 2024

As we look at manufacturing trends for 2024, pressure to stay on top of current trends and maintain competitiveness are at an all-time high

English
Automated bottling and packaging line in a manufacturing facility, with glass bottles moving through production equipment, representing production throughput, manufacturing output, operational efficiency, and process performance.
5
Dec 2023

Understanding takt time in manufacturing

Through real examples and practical insights, discover why measuring and monitoring takt time is the path to optimized production.

English
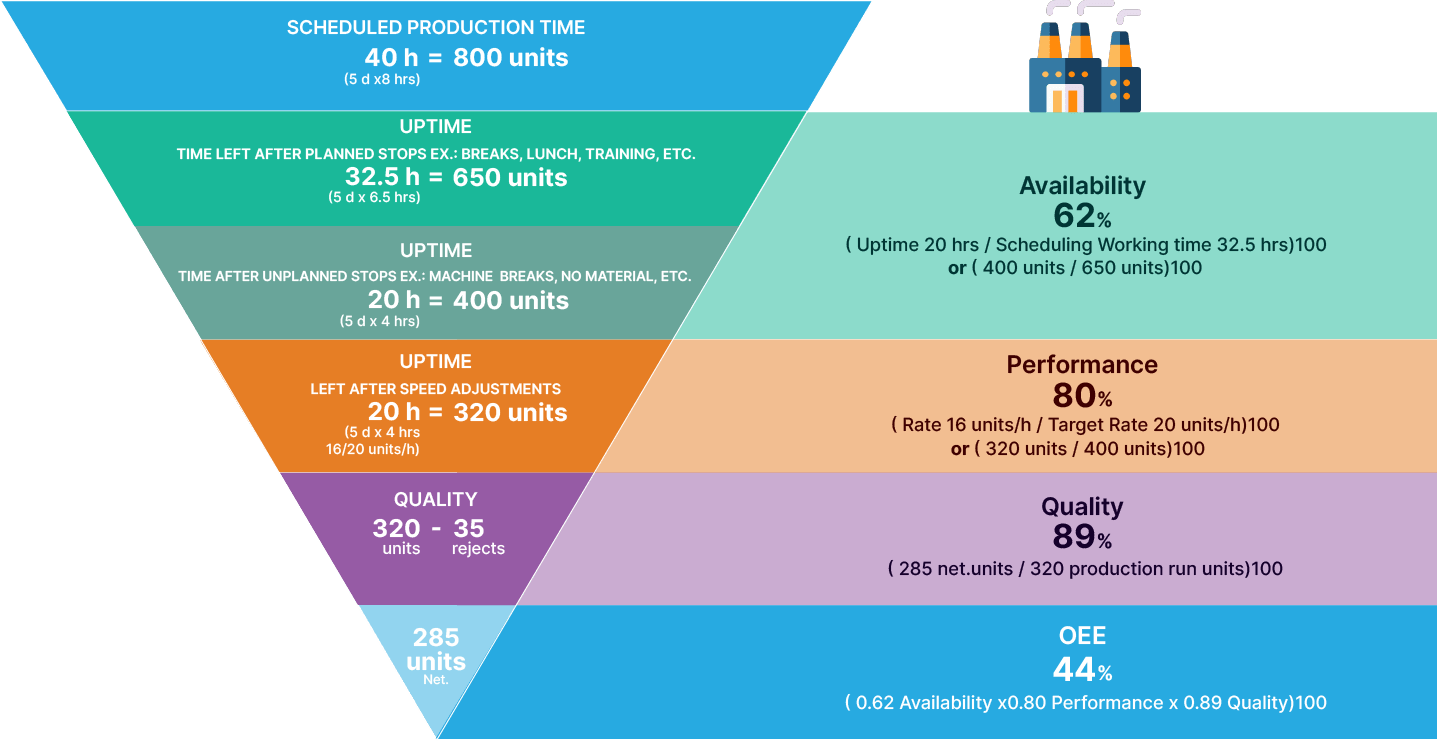
nfographic illustrating the major sources of Overall Equipment Effectiveness (OEE) losses in manufacturing, showing categories such as downtime, speed losses, and quality losses that impact production performance and operational efficiency.
15
Nov 2023

Decoding the OEE Calculation: Translating OEE Metrics into Tangible Losses

The following OEE funnel is a great way to visualize how losses in availability, performance, and quality impact OEE and your throughput.

English