10/8/18

Why Monitor Mixing Process? Deli Meat Processing Series Part 2

In the Deli Meat Processing Series Part 2, walk through the smart deli meat transformation process and an overview of the Worximity Smart Factory Roadmap, which helps you determine the best course of action to reduce production costs with real-time monitoring using TileBoard.

Food Manufacturing IIoT
Industry 4.0
Smart Factory
Smart Meat Processing
IIoT
Why Monitor Mixing Process? Deli Meat Processing Series Part 2

How can you optimize the deli meat mixing process? In the Deli Meat Processing Series Part 2, walk through the smart deli meat transformation process and help you determine the best course of action to reduce production costs with real-time monitoring using TileBoard.

Deli Meat Mix - batching

Typically, the next step after grinding in the meat processing value chain for deli sausage is mixing. Often in mixing we are working with machinery brands such as Weiler, Reiser, Hobart and others. A well-managed mixing process is essential for quality deli sausage product. It’s important for the ground protein mix, spices and flavorings to be mixed sufficiently to provide a consistent flavor throughout. Under-mixing leads to an uneven product and over-mixing creates a mashed product that is unappealing to consumers.


Most commercial meat mixers are operated through a PLC (Programmable Logic Controller) that automatically handles recipes. However, we find that operator error or lack of training can mean that the optimum mixing process for a specific recipe is not always followed.

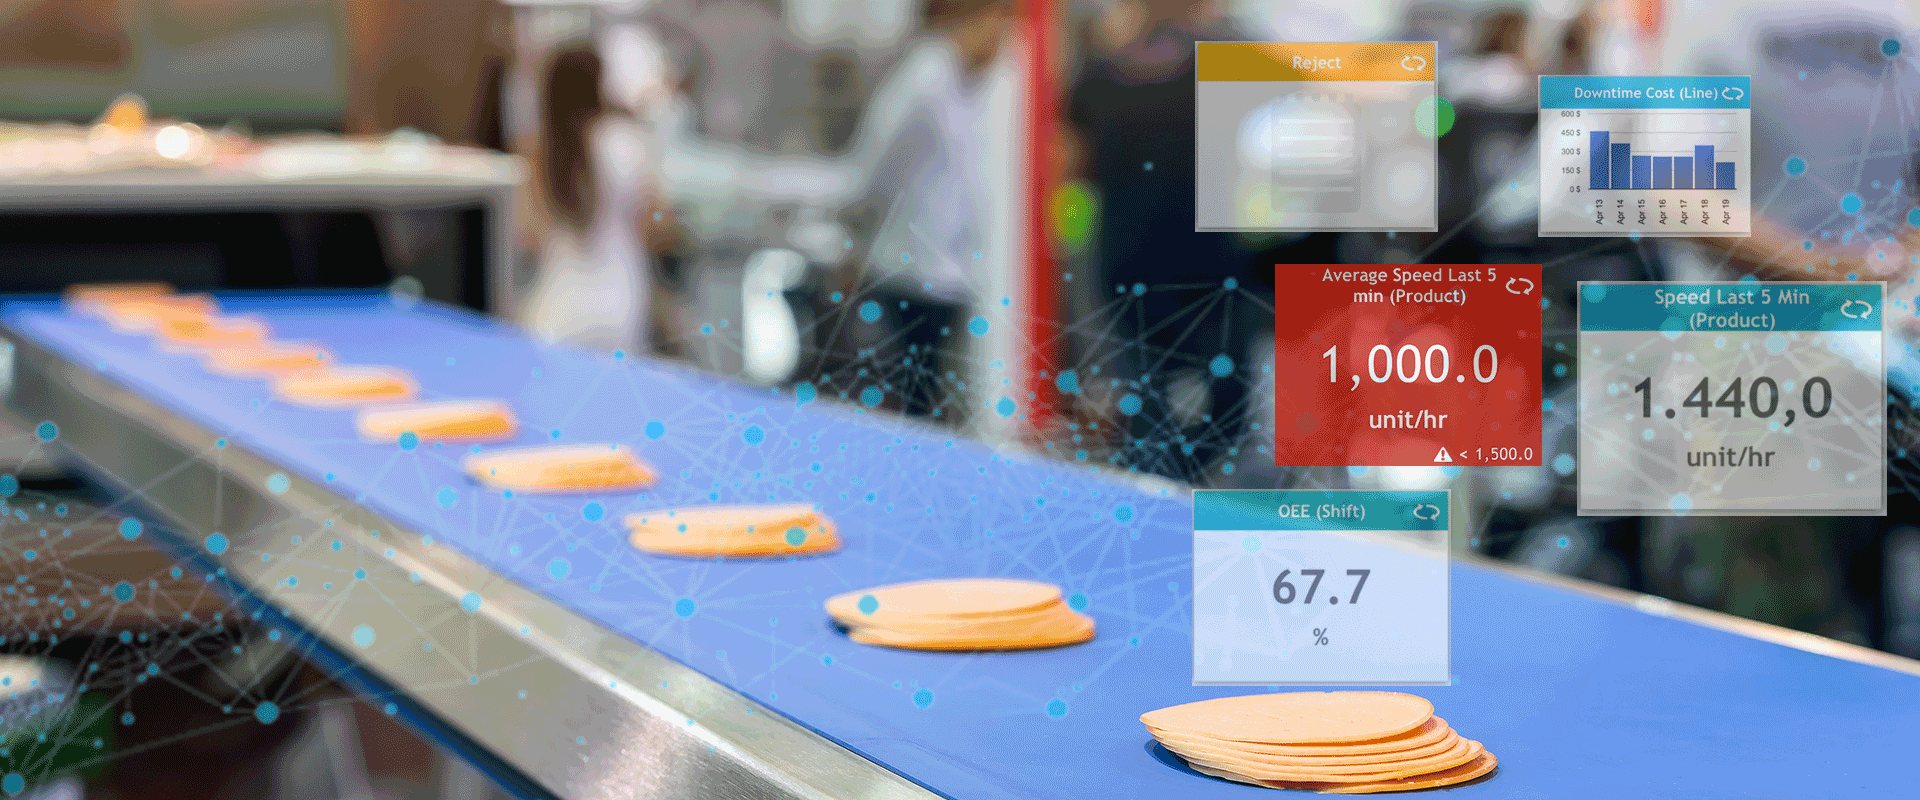
Monitoring the mixing process with TileBoard provides a quality backstop to ensure product consistency and to minimize the chances of producing a poor quality product.
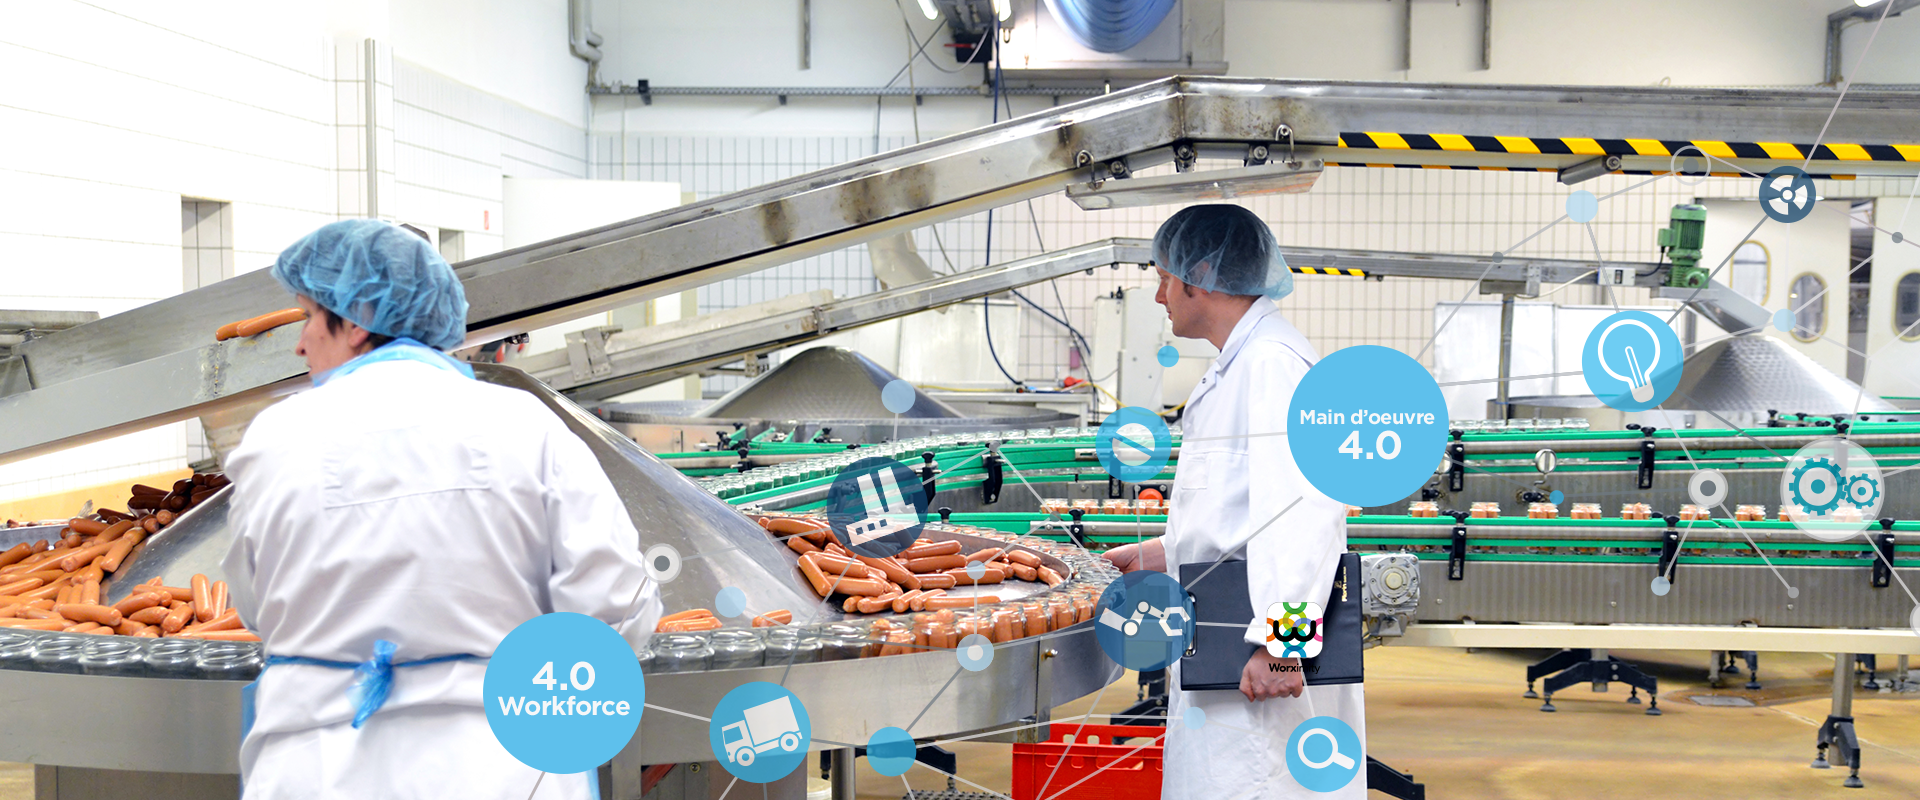
_Header_Meat_Pillar_1920x800_Slices


Deli Meat Mixing KPIs

  • Batch quantity
  • Batch mixing time
  • Batch weight (via a weigher or checkweigher connectivity)

In this video from the How It's Made series, see the deli meat process from start to finish.

 

Want to learn more?
Download the ebook
Related blog articles

Related articles

Back to the blog
Thank you! Your submission has been received!
Oops! Something went wrong while submitting the form.
2
Jul 2019

Succeeding in Industry 4.0 with Agile Leadership

English
22
May 2019

What Kind of 4.0 Leader Are You?

English
23
Oct 2019

How To Know If You Are Receiving Reliable Data from Your Production Line

English

Related articles

Back to the blog
Thank you! Your submission has been received!
Oops! Something went wrong while submitting the form.
Hand interacting with a futuristic digital interface displaying “2024,” AI icons, and technology symbols, representing emerging technology trends, artificial intelligence, digital transformation, innovation, and future-focused business strategy.
9
Jan 2024

Manufacturing Trends to Lookout for in 2024

As we look at manufacturing trends for 2024, pressure to stay on top of current trends and maintain competitiveness are at an all-time high

English
Automated bottling and packaging line in a manufacturing facility, with glass bottles moving through production equipment, representing production throughput, manufacturing output, operational efficiency, and process performance.
5
Dec 2023

Understanding takt time in manufacturing

Through real examples and practical insights, discover why measuring and monitoring takt time is the path to optimized production.

English
nfographic illustrating the major sources of Overall Equipment Effectiveness (OEE) losses in manufacturing, showing categories such as downtime, speed losses, and quality losses that impact production performance and operational efficiency.
15
Nov 2023

Decoding the OEE Calculation: Translating OEE Metrics into Tangible Losses

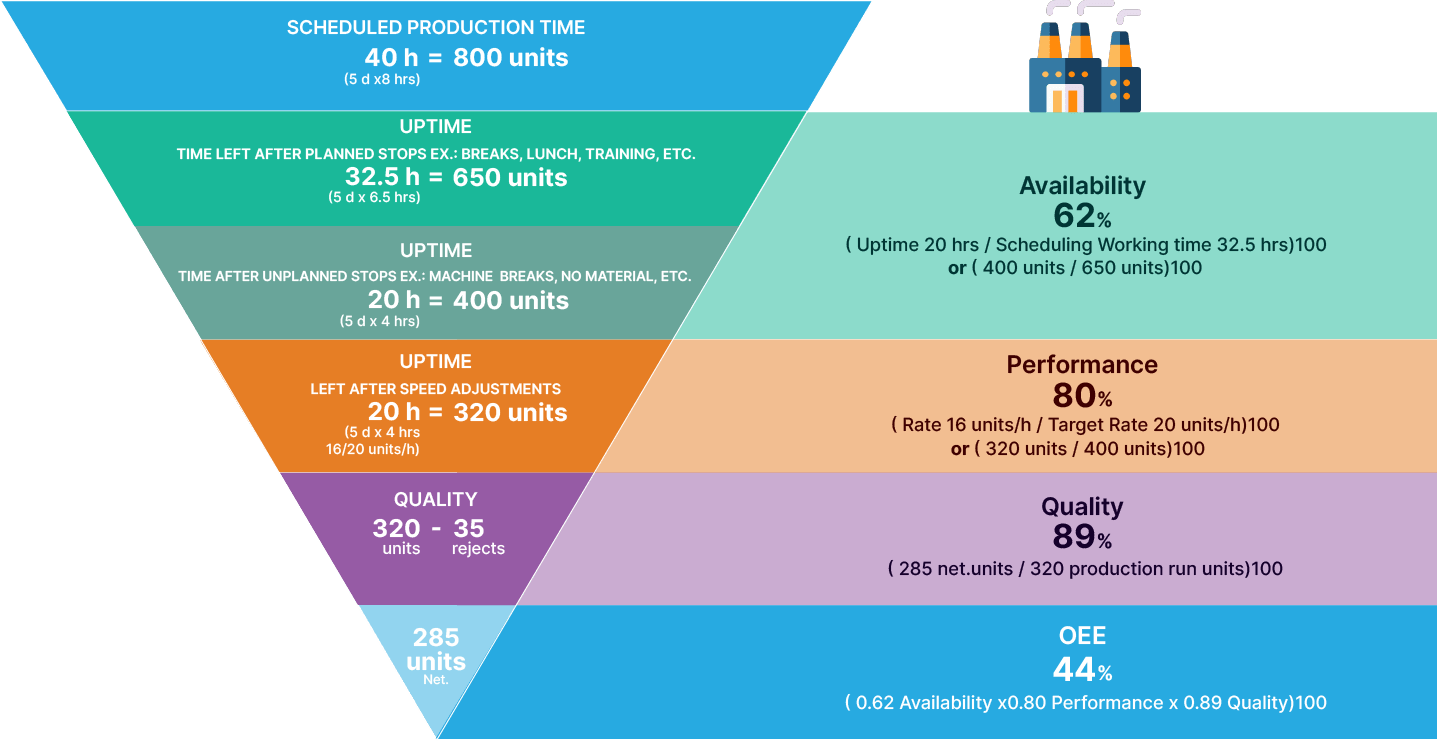
The following OEE funnel is a great way to visualize how losses in availability, performance, and quality impact OEE and your throughput.

English