Overall Equipment Effectiveness (OEE) is a universal metric for assessing manufacturing operational efficiency. While there's lots of information out there on how to calculate OEE and what it is, in this article we highlight how Worximity measures your OEE in its production monitoring solution.
OEE and Its Factors: Identifying Loss Areas
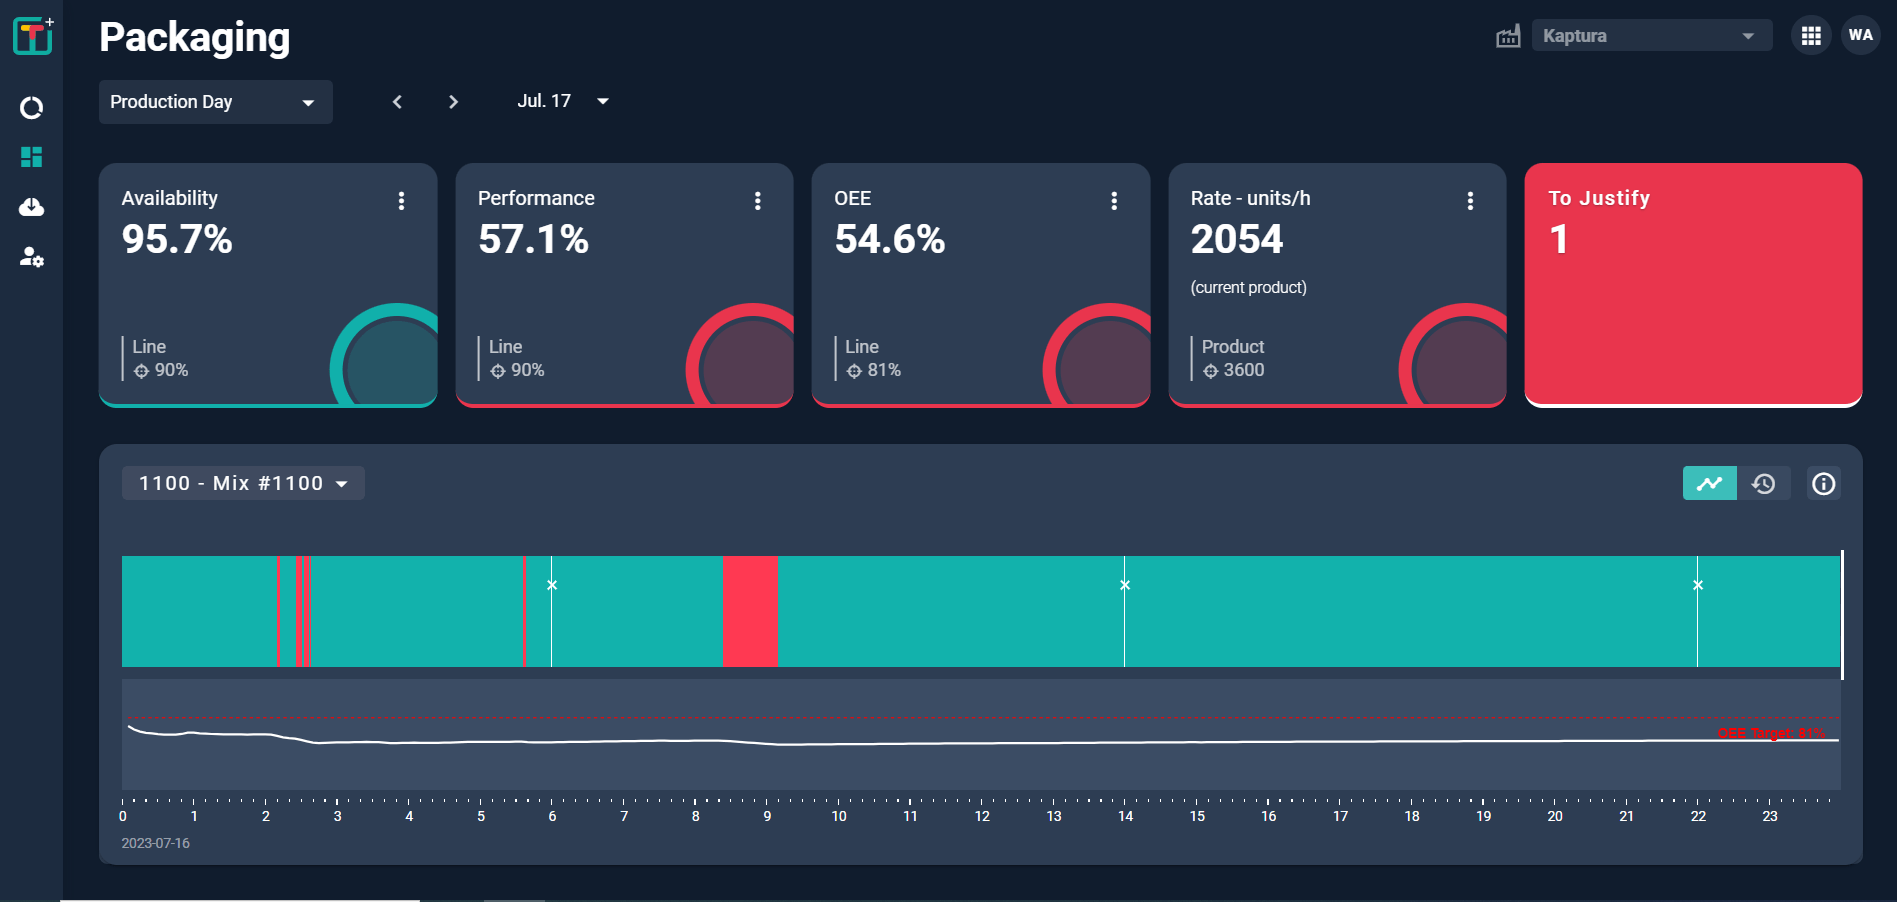
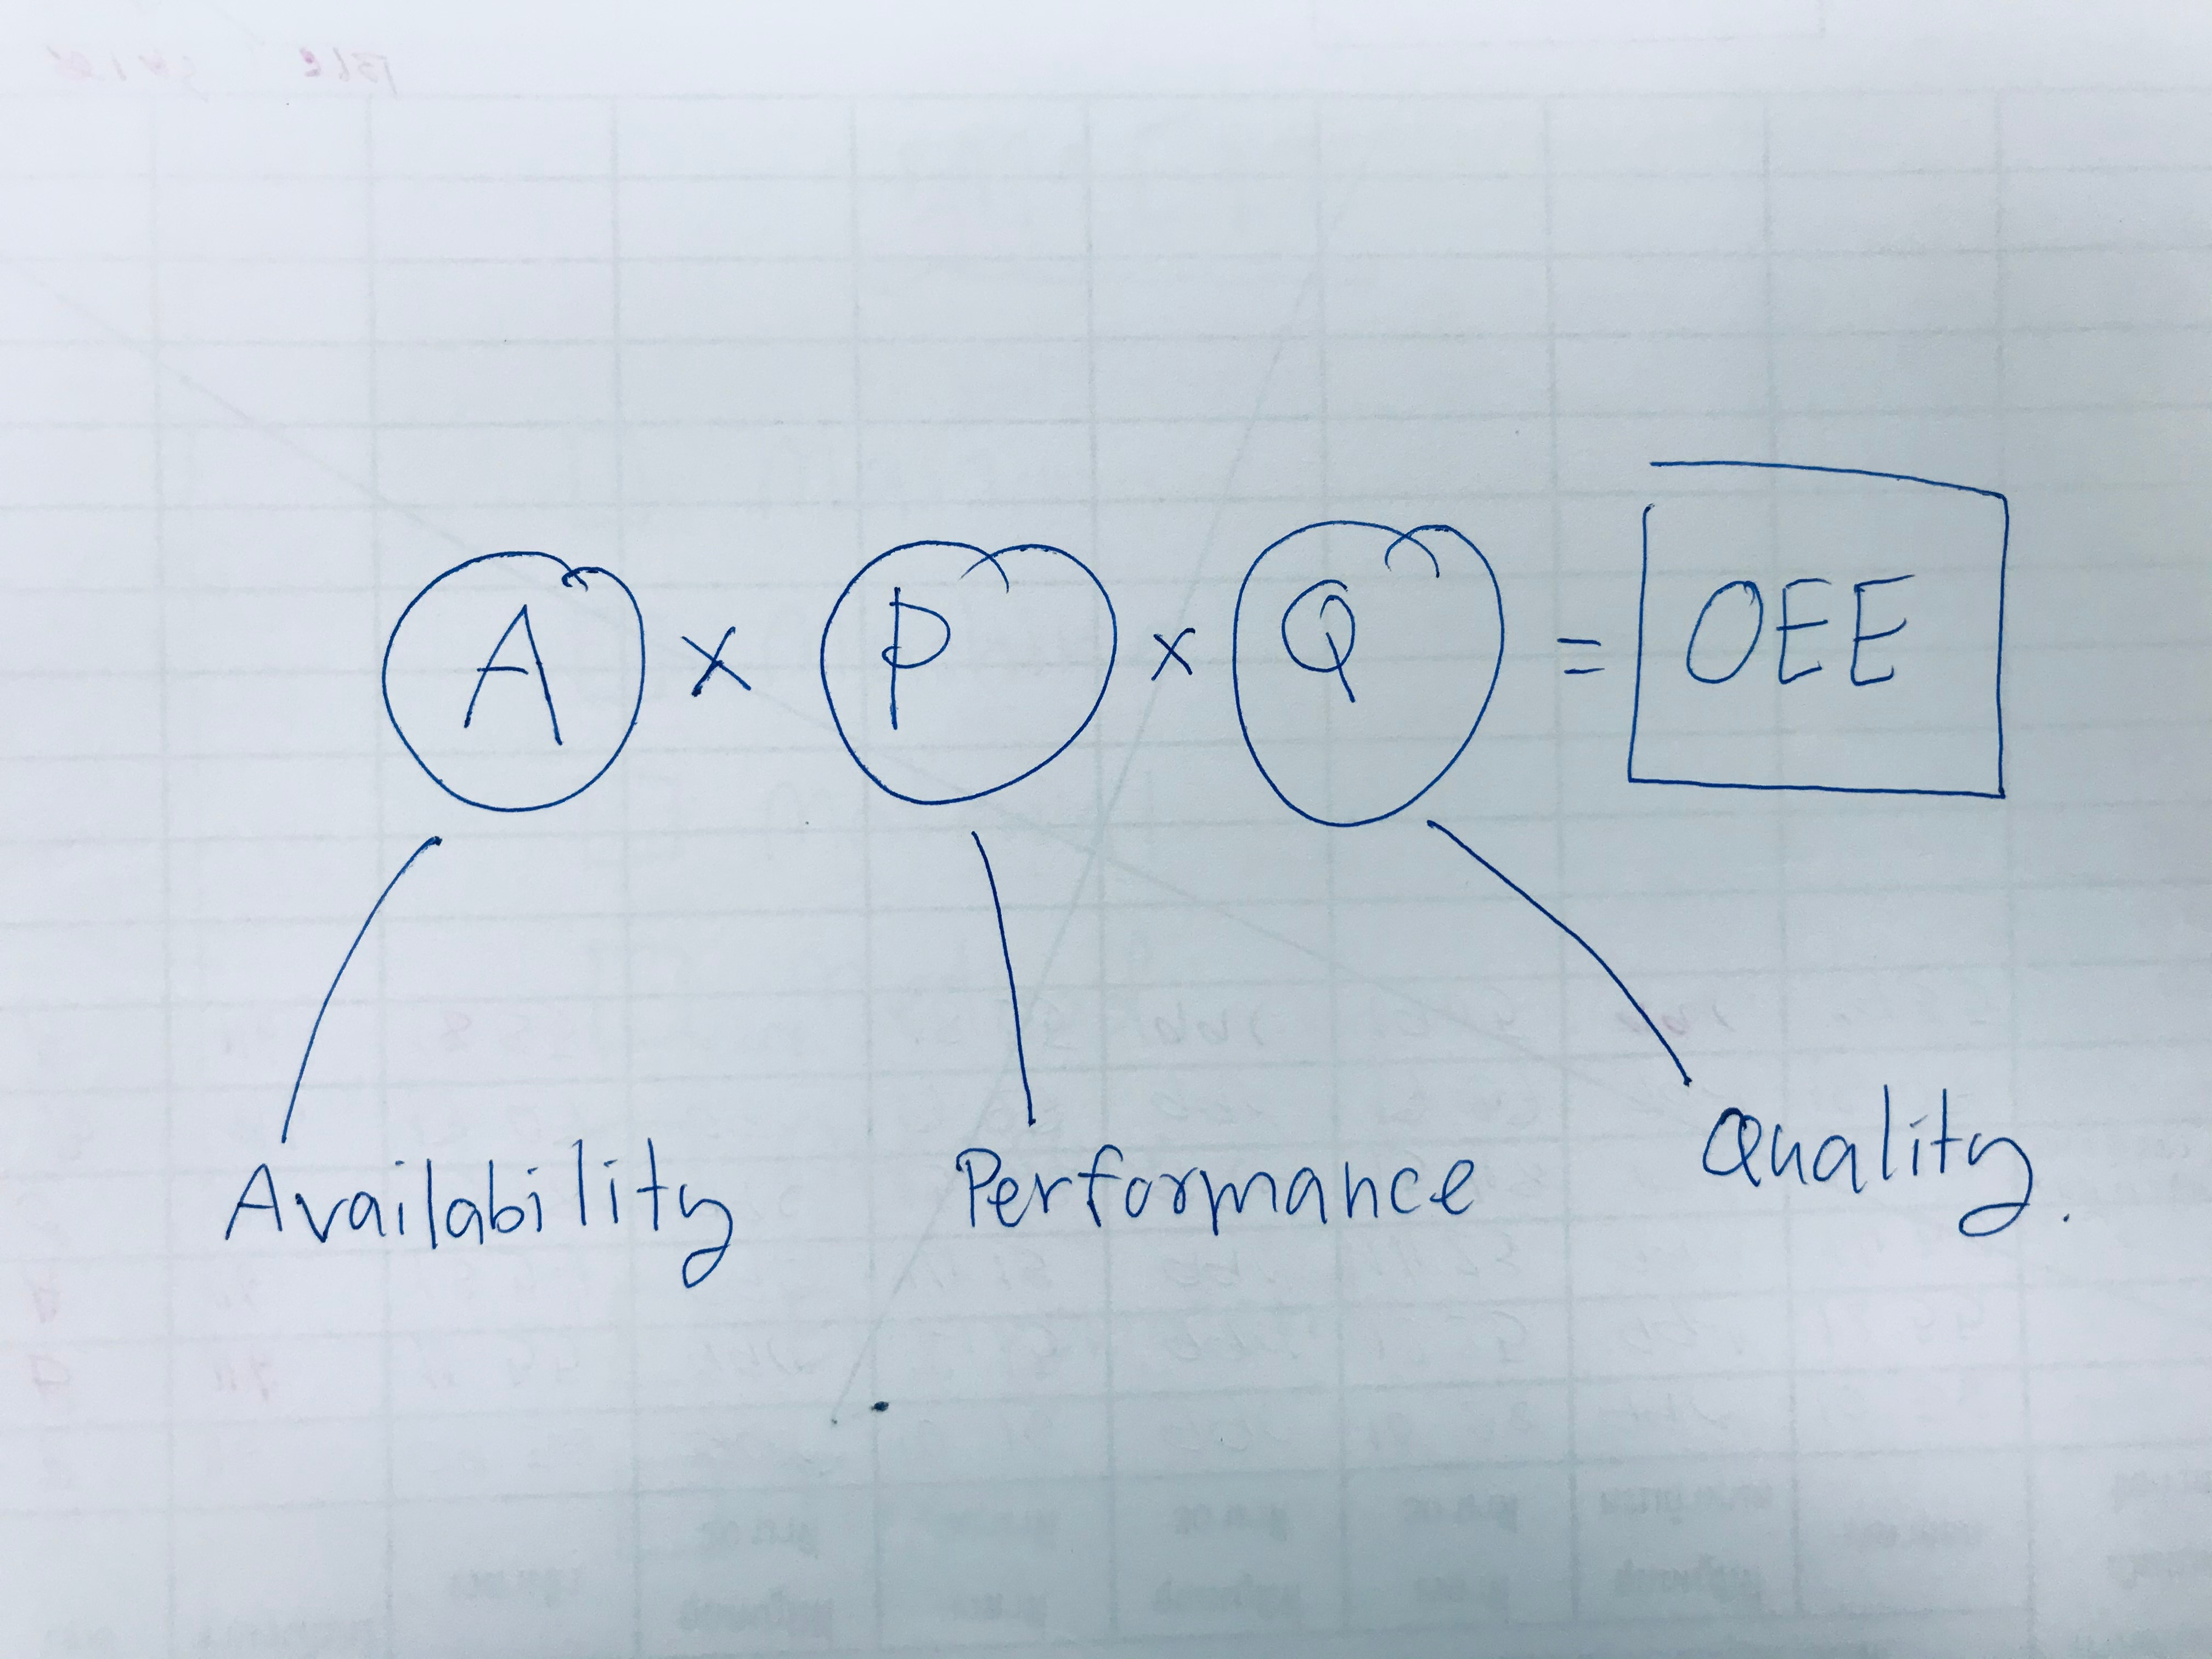
The OEE score serves as a snapshot of your operational status, with its three key factors—Availability, Performance, and Quality—playing pivotal roles in pinpointing areas where losses occur and guiding improvement efforts.
Let’s start by imagining a manufacturing plant with a production line that has:
- an 8-hour shift working 5 days a week (40 hours/week) and,
- a target rate of 20 units/hour (800 units/week).

Availability Loss: Unplanned Downtime
When a machine isn't running as it should be due to unplanned downtime like machine breaks or material shortages, it results in a loss of availability and reduced production time. It's important to note that scheduled downtime, such as breaks and lunches, is excluded from OEE calculations and falls under Overall operations effectiveness (OOE).
In the scenario above, if a total of 7.5 hours of planned downtime is scheduled for the week and the production line loses another 12.5 hours in unplanned downtime, it will produce 400 units instead of the potential 650 resulting in an availability of 62%.

Performance Loss: Speed Inefficiencies
Performance loss occurs when a machine operates below its maximum speed.
Returning to our example, if the line runs at 16 units per hour instead of 20 units per hour, it will produce 320 units out of the expected 400 – a performance of 80%.

Quality Loss: Falling Short of Standards
Quality loss happens when produced units don't meet required standards, resulting in rejects and the need for rework. In our scenario, 35 units were rejected during the quality check process generating a quality score of 89%.

Summary: Quantifying Losses in Time, Units, and Money
When any of the OEE factors falls below 100%, it indicates a quantifiable loss in terms of time, units, and money. In the given example, the net units left were 285 out of the planned 650, highlighting the impact of unplanned downtimes, suboptimal speed, and quality issues.

By diligently monitoring and optimizing these factors, you can make significant improvements at every stage of your production process, leading to increased efficiency and cost savings.
OEE Benchmarks Setting Realistic Targets
Seiichi Nakajima introduced the concepts of OEE and total productive maintenance (TPM) in the 1970s. In his book, Introduction to TPM, he suggested four “world-class” numbers: availability of 90%, efficiency of 95%, and quality of 99%, yielding an OEE of 85%.
- 100% OEE is considered perfect production
- 85% OEE reflects world-class operations
- 60% OEE is typical and average
- 40% OEE is low but not uncommon
Industry-specific variations exist, and targets may differ based on company size, type, and operational nuances.
In assessing your OEE, it's crucial to consider the realistic dynamics of your operations. Differences exist between manufacturers with large and small product mixes, influencing target numbers for availability, efficiency, and quality. Start by downloading our free OEE calculator.