We stumbled upon this very neat infographic representing the Artificial Intelligenceprogression in various sectors like manufacturing with Industrial Internet of Thing and Industry 4.0.
By 2020, the estimated size of the Artificial Intelligence based analytics market will be $70 billion (compared to $8.2 billion in 2013).
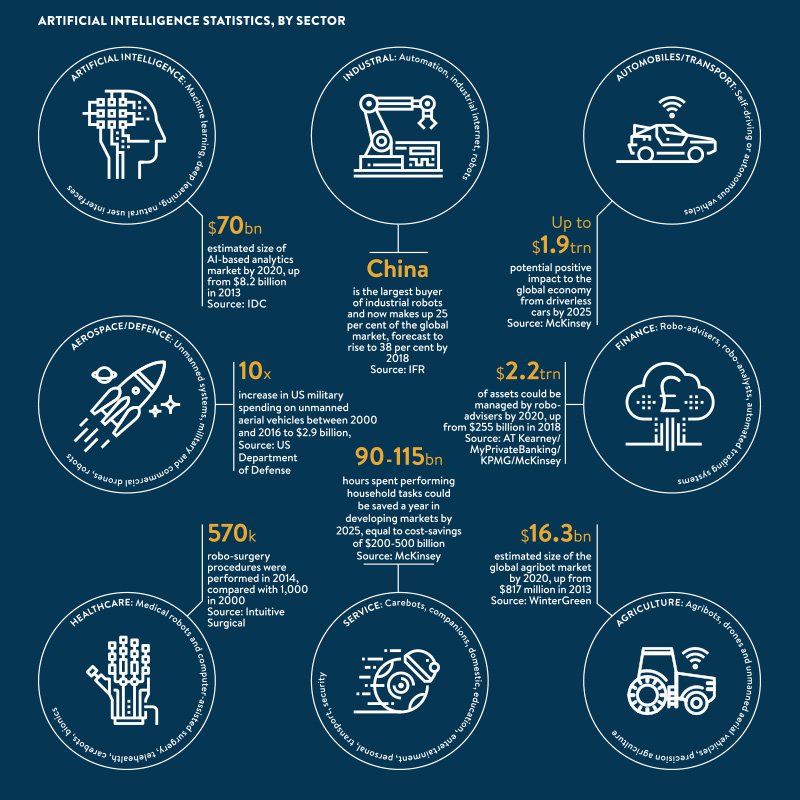
For an even deeper analysis of the sector, read the article Artificial Intelligence Industry – An Overview by Segment published on Tech Emergence: techemergence.com

Related blog articles