11/7/18

Worximity's TileBoard: Monitoring Typical Meat Processing KPIs

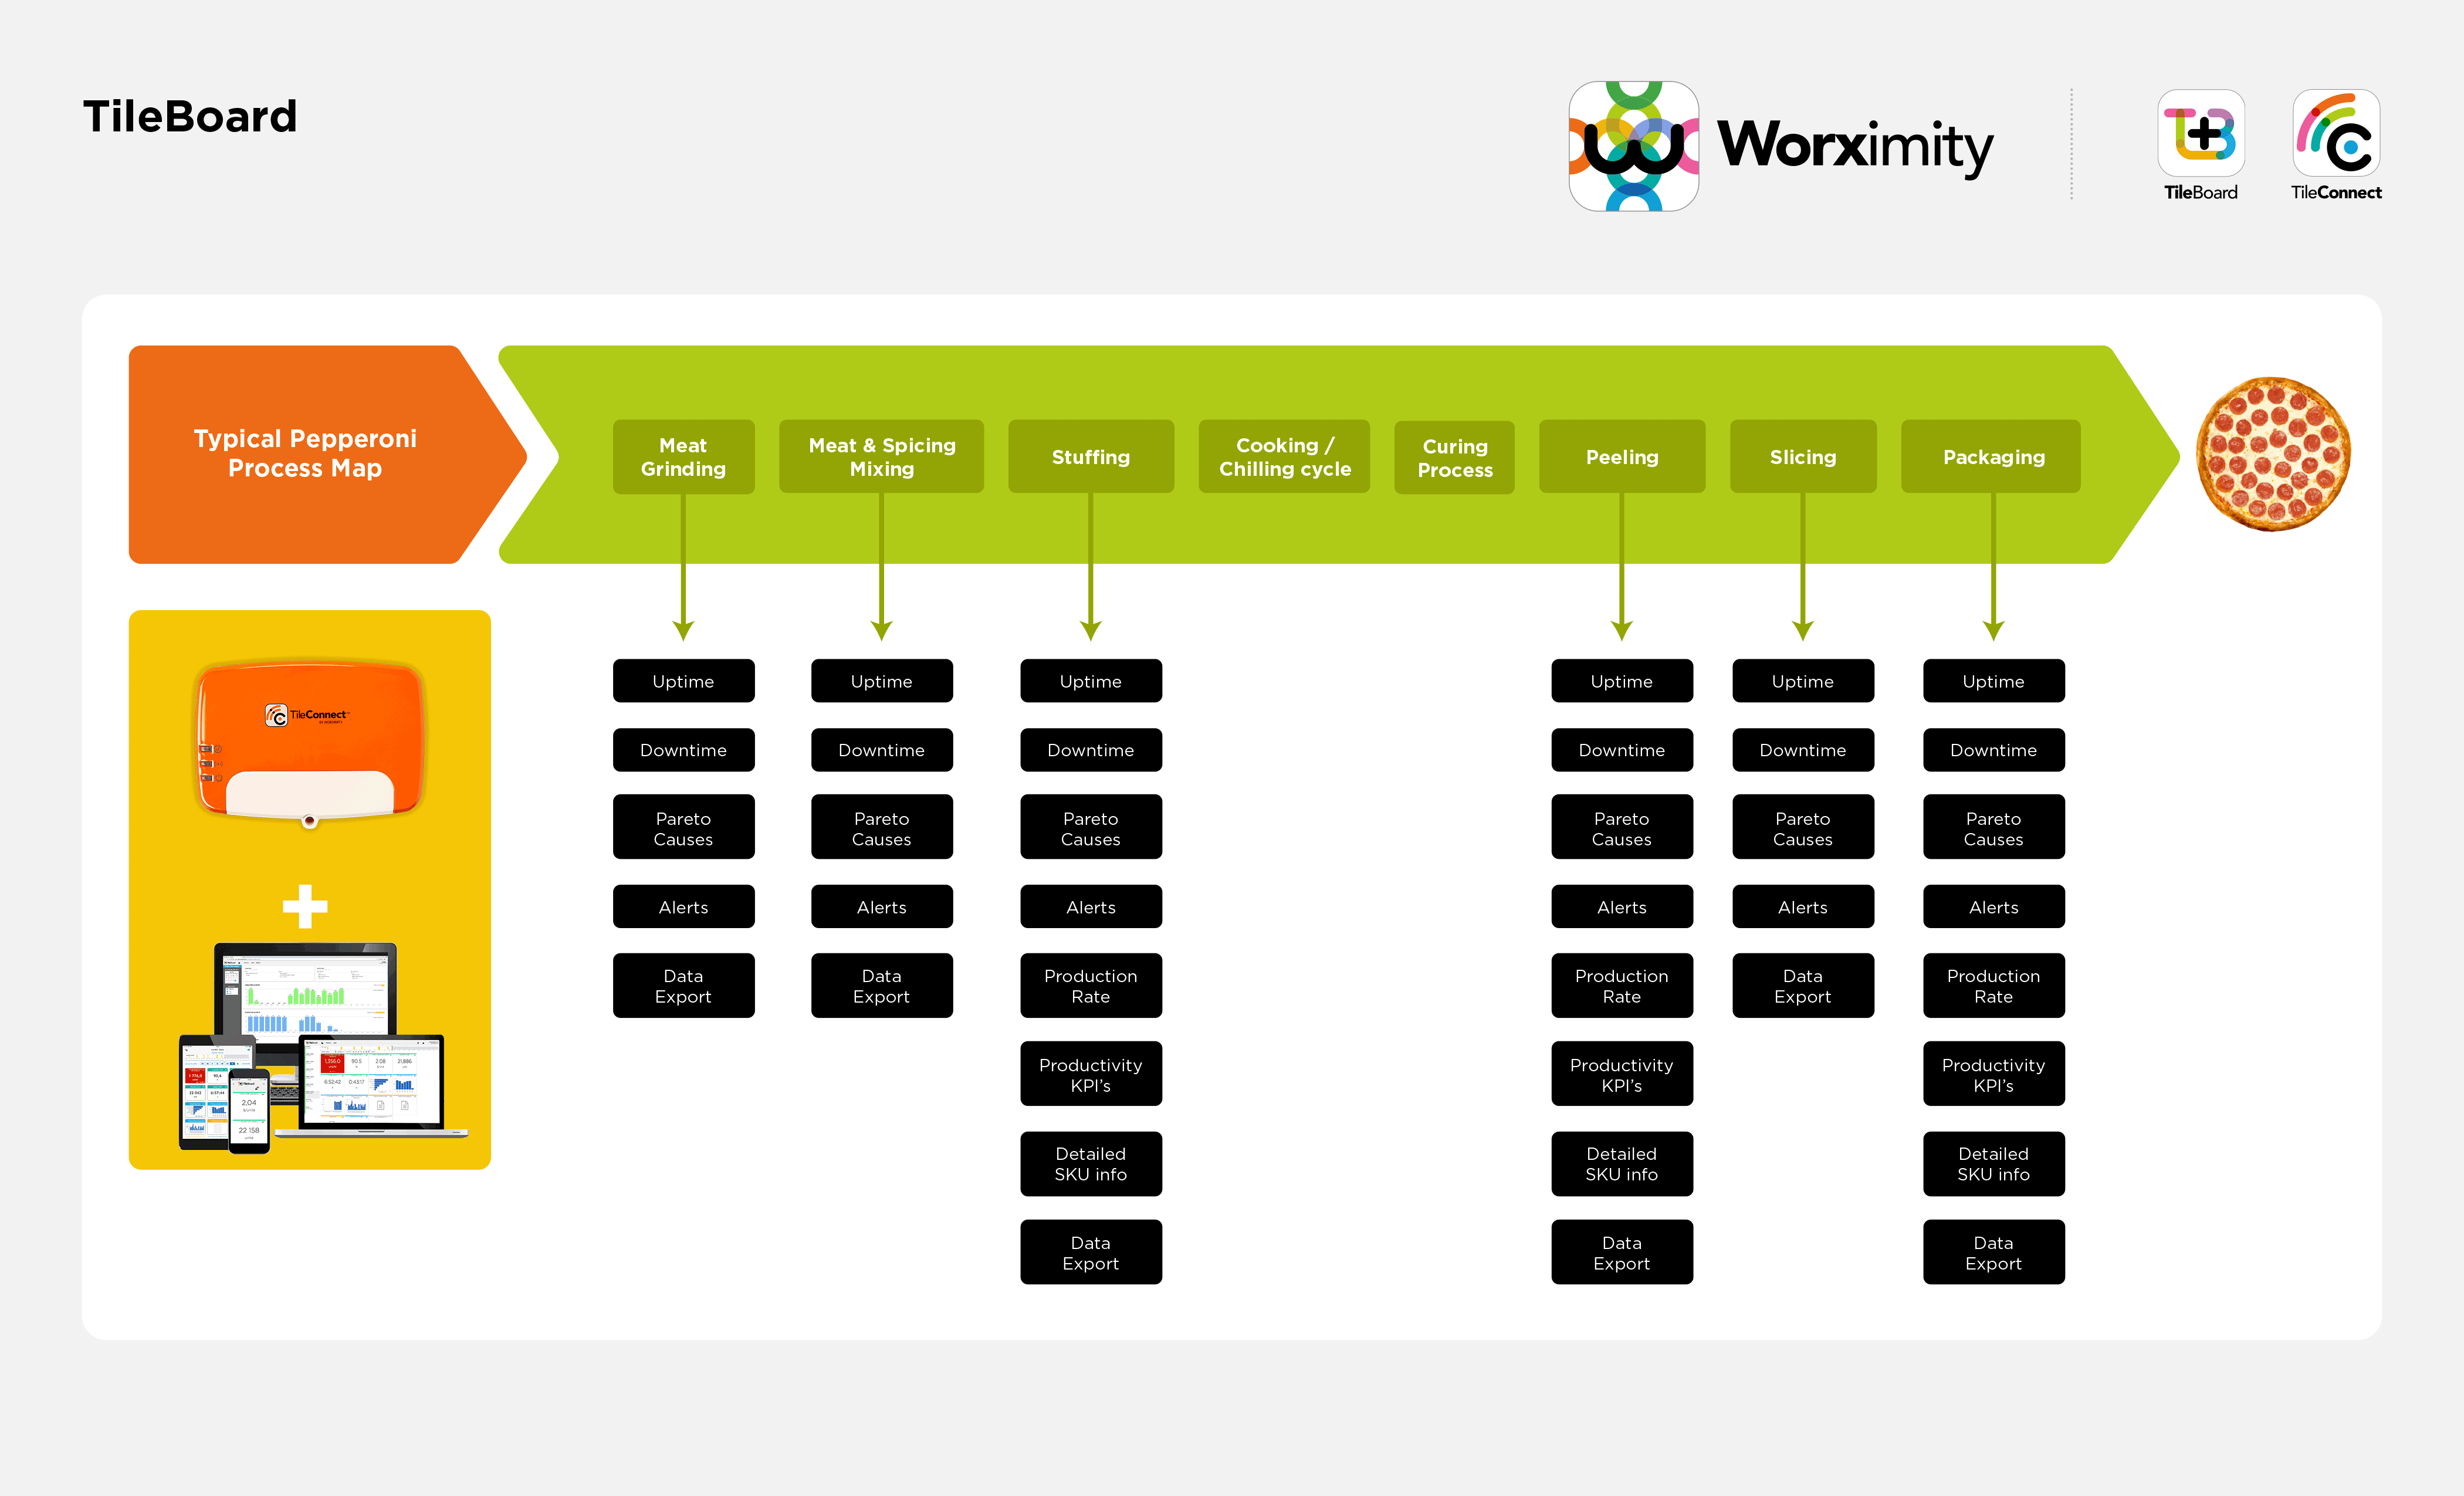
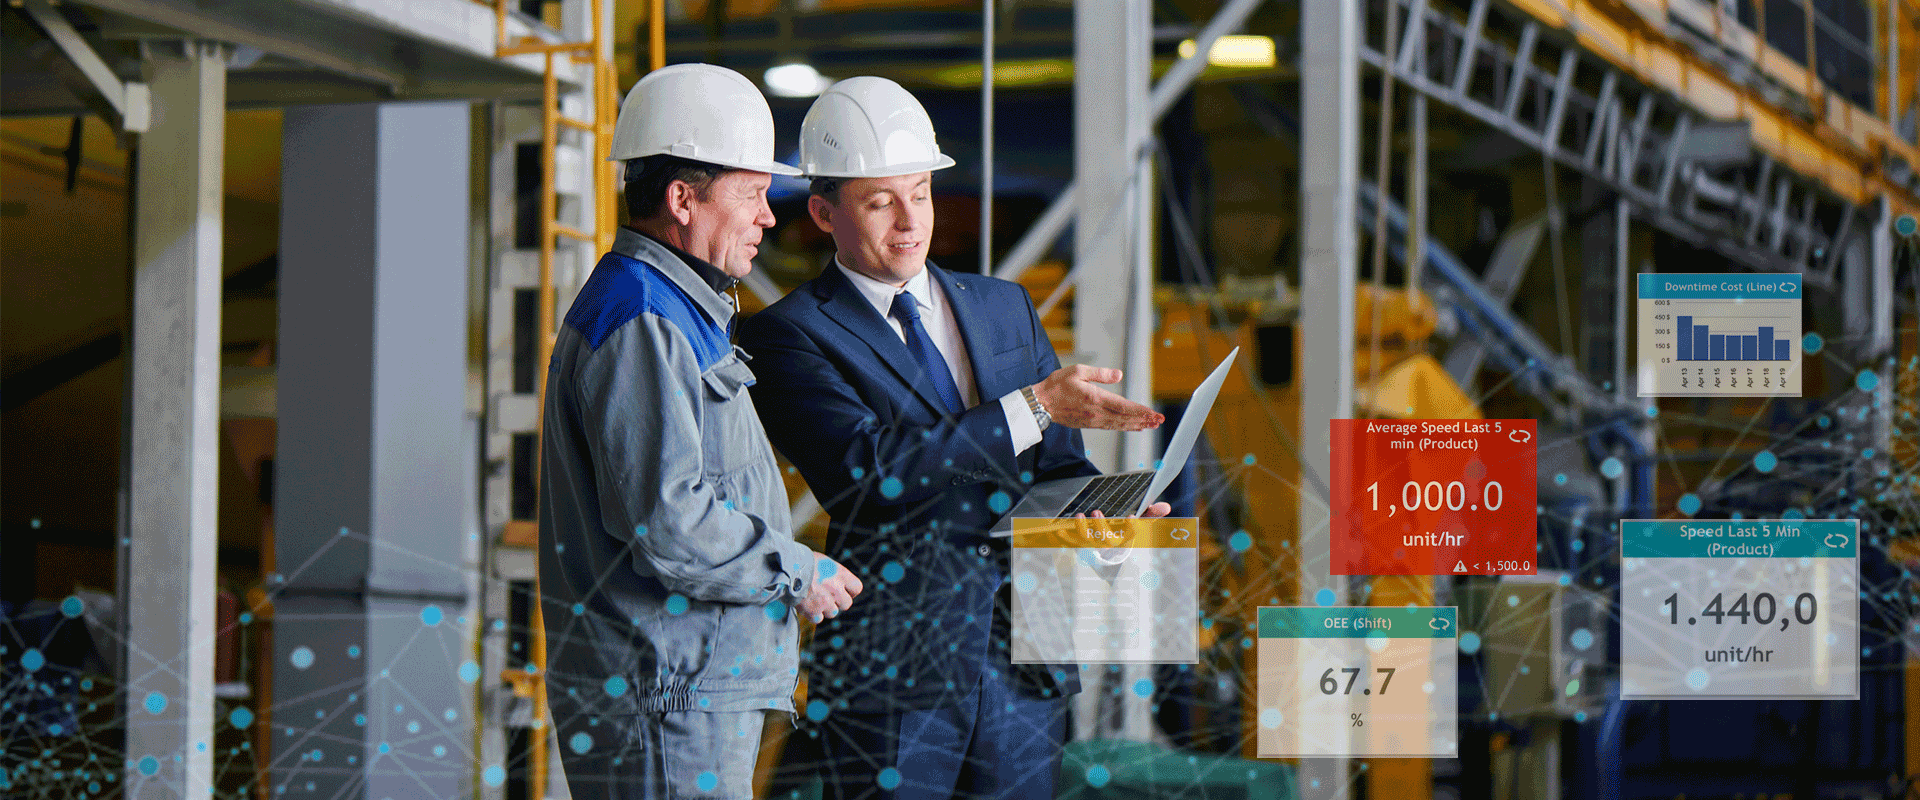
This infographic shows Wx's TileBoard and a typical meat processing map from start to finish.

Food Manufacturing IIoT
Industry 4.0
Smart Factory
Smart Meat Processing
Worximity's TileBoard: Monitoring Typical Meat Processing KPIs


The smart factory set-up using the Worximity TileBoard Production Process

The infographic below outlines the typical KPIs monitored in the deli meat production process from start to finish with Worximity TileBoard in place. Worximity connects all type of machines and all brands : CEIA, Loma, Mettler Toledo, RiceLake, Bizerba.

  1. Uptime
  2. Downtime
  3. Production Rate
  4. Productivity KPIs
Worximity_Meat_Processing_Monitoring_KPIs

This case study based on the Voltigeurs Poultry Farm experience sheds light on how to achieve increased productivity, yield and profitability as a smart factory using TileBoard.

Learn about how to gain real time production insights and schedule a discovery call with a Worximity expert. Find out how to implement the process in your food and beverage factory.


Did you read all of the posts in our 5-part series? If not, you can easily access them by clicking here:

>>> KPI #1 - Downtime

>>> KPI #2 - Rejects Identified by Metal Detectors 

>>> KPI #3 - Meat Temperature

>>> KPI #4 - Yield

>>> KPI #5 - Overproduction (giveaway)

Want to learn more?
Download the ebook
Related blog articles

Related articles

Back to the blog
Thank you! Your submission has been received!
Oops! Something went wrong while submitting the form.
Hand interacting with a futuristic digital interface displaying “2024,” AI icons, and technology symbols, representing emerging technology trends, artificial intelligence, digital transformation, innovation, and future-focused business strategy.
9
Jan 2024

Manufacturing Trends to Lookout for in 2024

English
3
Aug 2023

Embracing IIoT: The Smart Path for OEMs to Thrive with a Leading IIoT Smart Manufacturing Partner

English
21
Jul 2023

CDAP: $15,000 Grant To Jump Start Canadian Manufacturing Digital Transformation Projects

English

Related articles

Back to the blog
Thank you! Your submission has been received!
Oops! Something went wrong while submitting the form.
Simple infographic showing a downward arrow for downtime and an upward arrow for throughput, illustrating the relationship between reducing production downtime and increasing manufacturing throughput, efficiency, and operational performance.
17
Oct 2023

Maximizing Uptime: Strategies for Reducing Downtime and Boosting Throughput

Discover expert strategies to maximize uptime and throughput in manufacturing, from reducing changeover times to eliminating bottlenecks and unlocking hidden capacity.

English
Lean manufacturing infographic featuring diagrams, charts, and key performance concepts related to waste reduction, quality improvement, and operational efficiency, illustrating the connection between Lean principles and Overall Equipment Effectiveness.
16
Oct 2023

The Synergy Between Lean Manufacturing and OEE Monitoring

Overall Equipment Effectiveness (OEE) monitoring plays a crucial role in the realm of lean manufacturing, serving as an essential tool to assess and enhance the efficiency and productivity of manufacturing processes.

English
Aerial view of a forest with a digital production icon overlaid on the landscape, symbolizing sustainable manufacturing, environmentally responsible production processes, green operations, and the integration of technology with sustainability.
21
Sep 2023

Smart Manufacturing: It's Not Only Productive, It's Sustainable

Production monitoring technology can serve as a crucial catalyst for manufacturers embarking on their ESG journey.

English