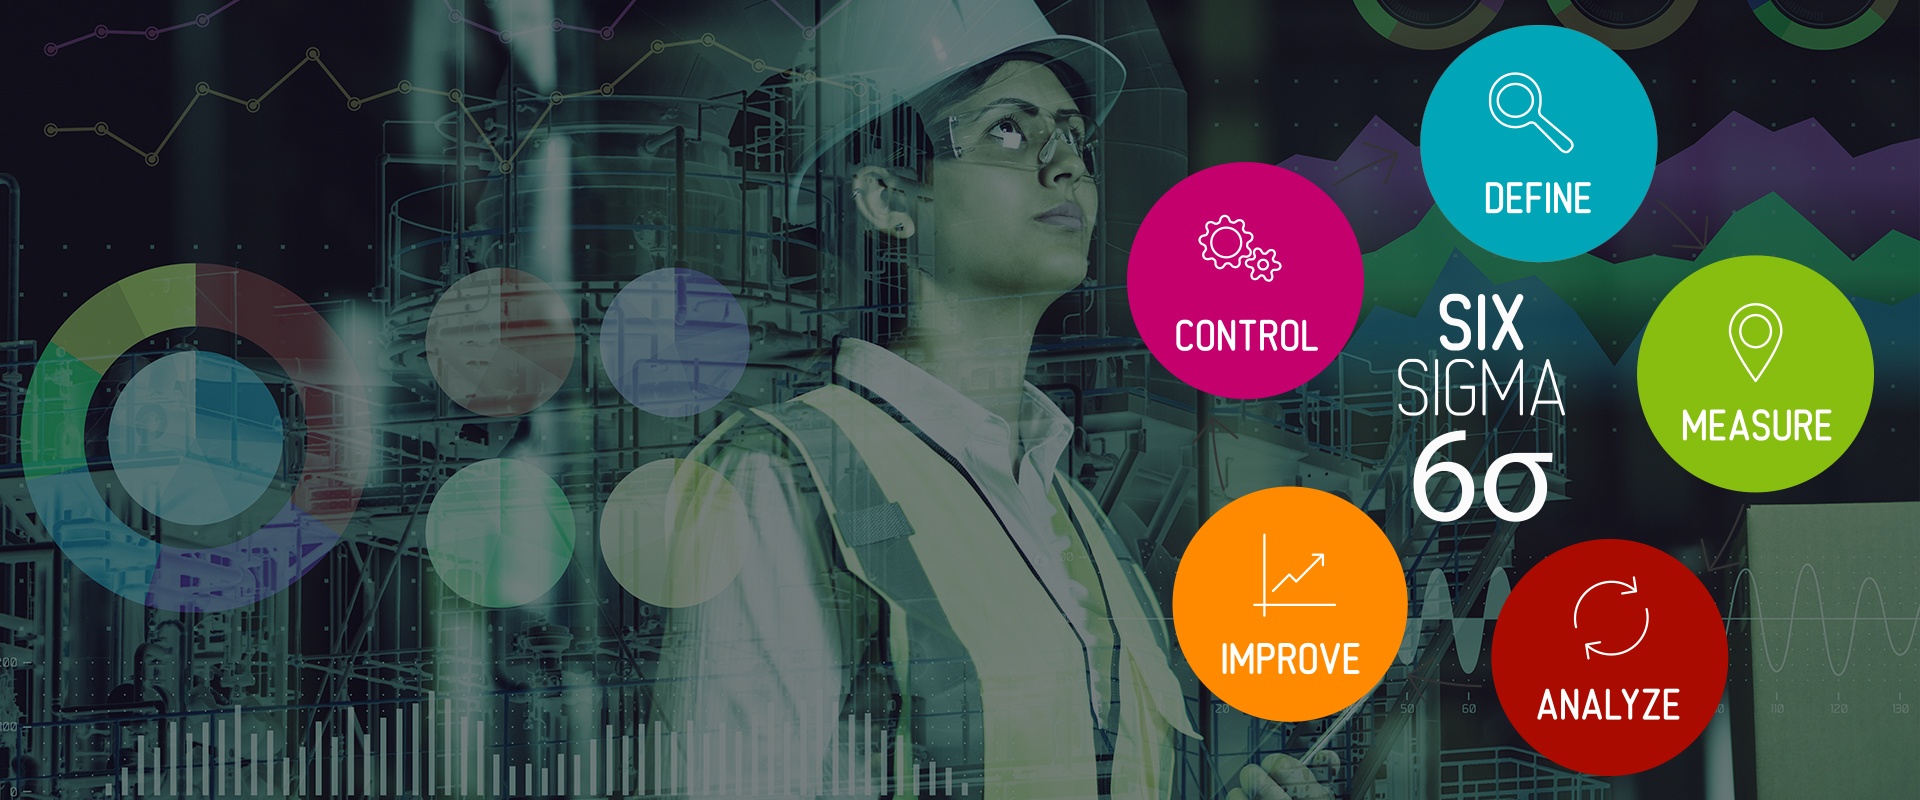
You have seen huge quality gains thanks to your lean manufacturing and Six Sigma programs. Why would you interfere with what works and shake everything up by trying to apply Industry 4.0 principles?
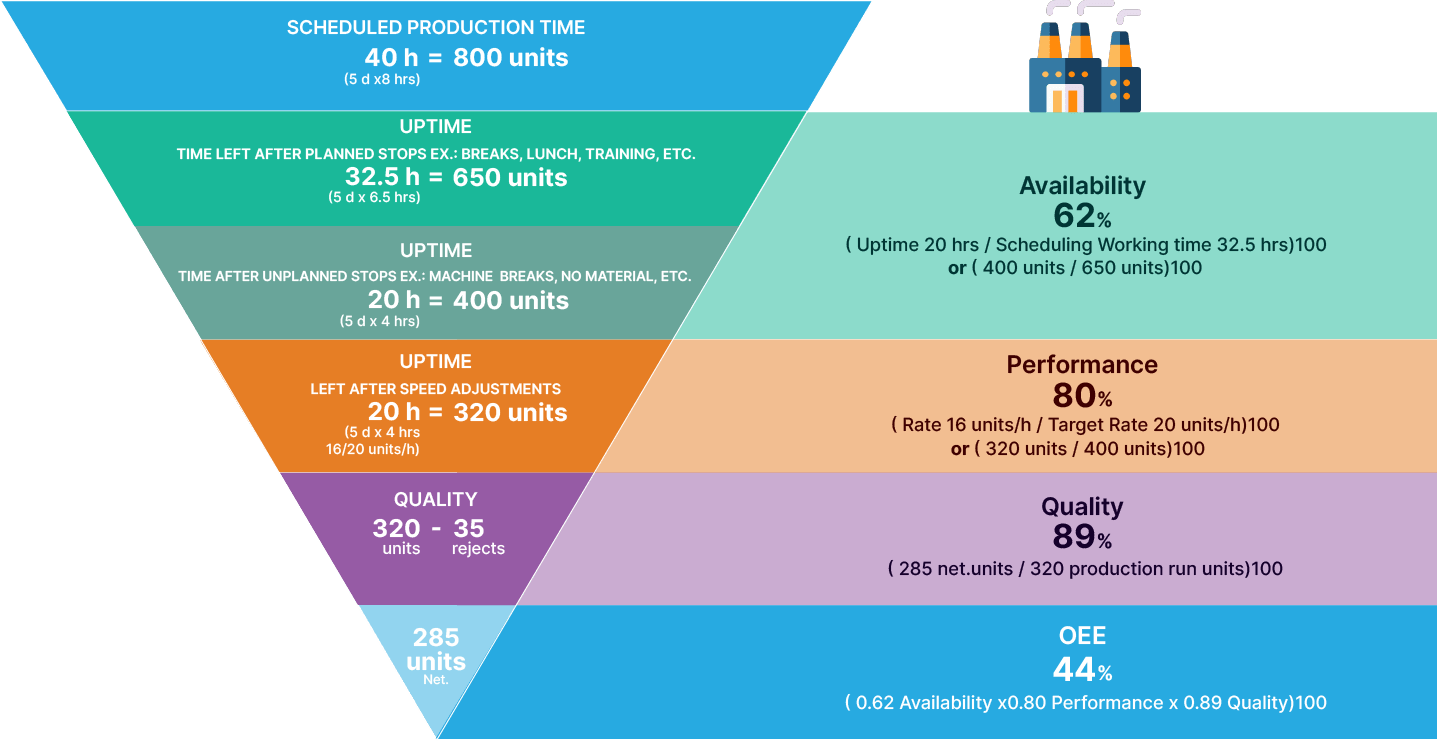
That is a question I often hear from manufacturers, and there is a good answer. Industry 4.0 does not need to reinvent your processes. In fact, we recommend customers start with their key performance indicators (KPIs) and roll out a production monitoring solution that gives them better data on those KPIs.
Real-time monitoring of KPIs that are easy to consult drives continuous improvement
I also hear from time to time that Industry 4.0 is so complex you need training to take part. Not true. Of course you will need technicians for the rollout, but if you pick the right solution, connectivity removes technical barriers, it does not add them.
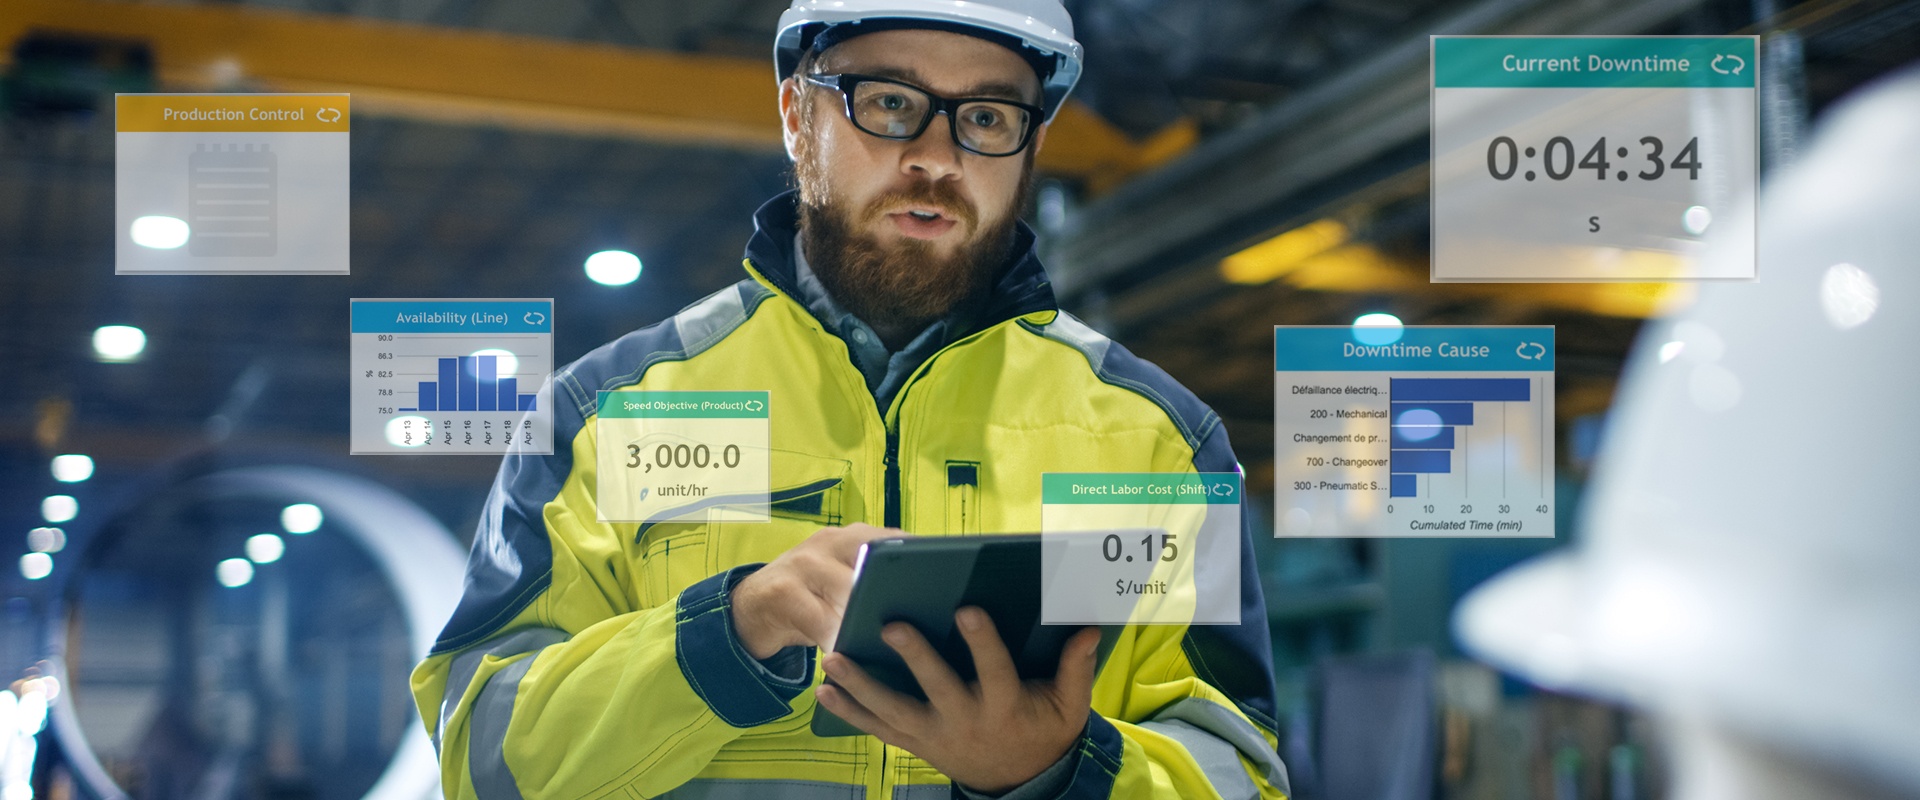
Let me give you an example. Today, if your managers and operators want to know how a line is performing, can they pull average KPIs in seconds? Or do they have to run manual checks and ask someone in IT to manually build a custom report? With a monitoring system that displays KPI information on a screen, summarized in easy-to-read color charts and tables, operators and other employees on the floor can see the real-time status of every displayed KPI. The same information can be sent to managers on their smartphone, a device they already know. Yes, setting up sensors and controllers has some technical complexity, but a basic monitoring solution can be deployed in just a few hours.
Aggregated data can improve quality for internal customers
Do you know how much time your production cells lose waiting for the previous or next operation? How about being able to track the top five bottlenecks and the wait time each one causes per average cycle or per week? Would you be better equipped to take corrective action? Monitoring solutions rolled out as part of an Industry 4.0 program can shine a light on problem areas of production that are hard to pinpoint without automated data. Small interruptions may seem normal or routine to an operator, but added up they can reveal a bigger issue that needs to be fixed to help the whole line run more efficiently.
Use Industry 4.0 to increase value for the end customer
Think of Industry 4.0 in terms of connectivity and communication. By connecting the plant to the executive office, you get up-to-date, higher-quality data for strategic decisions. For example, with more data, you can decide when and how to add a wider variety of low-volume products to your offering and whether such a move makes sense. Would custom products be a competitive edge if you could produce them more economically? Would you gain market share with a more varied product offering and the ability to respond faster to market demand? Would you have more success offering low-volume products that support specific market initiatives? By collecting and analyzing data from the plant, you can move beyond estimates and prepare solutions that support your customer satisfaction and engagement goals.
To learn more about KPI monitoring and display, see the Factory Dashboard page.