Efficient factories deliver in every way to stay productive and please end customers. But with so much activity on the floor each day, it can be hard to know which parts of your operations should be front and center.
There are numerous aspects to consider, but for now, we’ll limit our discussion to four KPIs in the food industry to keep a close eye on. Keep reading to learn about each, as well as why monitoring is important and how your core KPIs have a ripple effect on overall performance.
4 Essential Efficiency KPIs
Operating standards help you ensure that your factory is doing its best throughout each shift, as well as in the long term. KPIs in the food industry are directly related to operational efficiency, including throughput, yield, and downtime.
Throughput
Each day, your factory and its machines manufacture large quantities of product. The volume of products across machines and lines over a set period of time is called throughput. If production starts to bottleneck, your throughput nosedives accordingly, wasting time and raising costs. Software solutions like Tile+ monitor throughput to ensure efficient output on the factory floor.
Yield
Just like throughput, yield is a KPI in the food industry that measures product manufacturing, but it highlights the percentage of correctly manufactured products against those requiring rework. If you run into situations in which product rejects and rework are piling up, you likely won’t meet your targets and instead will have additional waste. As a result, costs increase, production volume takes a hit, and overall equipment effectiveness (OEE) decreases.
Downtime
Comparing machine downtime to actual runtime shines a light on your productivity. Material jams and equipment failures are common culprits of downtime, affecting productivity. If your operations experience too much downtime—planned or unplanned—your operation loses efficiency and money, and it might be time to make upgrades or systemwide improvements. Worximity helps you make analytical decisions for your operations, thanks to Tilelytics. Tilelytics provides insights into factory floor data, improves production efficiencies, and helps you minimize downtime.
Kilogram per Hour per Man Hour
The kilogram per hour per man hour metric brings forward the concept of how your net throughput can change based on how many people are on the line.
Kilogram per hour per man hour is expressed as number of cases/hour ÷ number of laborers = X cases/man hour.
The measure is rarely as linear as doubling your throughput with twice the labor, but kilogram per hour per man hour is a vital KPI to use to optimize resource allocation.
Example: Should you run the first line with all 10 available workers, then run the second one with those same people? Would it be more productive to run the first line at six people and the second one at four people?
Staying on Top of KPIs in the Food Industry
Throughput, yield, and downtime each affect your factory’s performance on a daily basis. It’s essential not only to know their raw numbers but also to closely monitor each of these KPIs to make smart logistical, financial, and operational decisions.
Monitoring Throughput
By keeping a close eye on throughput, you have the power to see how efficiently both your machines and your work shifts are performing. Here, you can uncover data about system bottlenecks and operational issues across your factory. With this information in hand, it’s easier to address how your machine(s) and shifts function and make any needed adjustments, improving both throughput and OEE.
Examining Yield
Looking at yield as a core KPI, you have insights into how aspects of your operations, its machines, or even your staff can hinder productivity. That means you can see inconsistencies on the factory floor—such as when machinery or production lines are producing flawed yields—and adjust accordingly. Getting back on track and delivering accurately and on schedule helps reduce waste and decrease costs, ultimately positively impacting OEE.
Identifying Downtime
Downtime (especially unplanned) is an essential KPI in the food industry to help you adjust your operations because when work is stalled, you’re not making progress! By closely monitoring downtime, you get insights into bottlenecks at the machine, line, time, and shift level, revealing trends in downtime events.
Here, you can see specifically why each downtime event happened in real time, making it easier to take action. By examining machine reason codes, shift logs, and operational data, your team can quickly enact solutions to save time and money, plus avoid waste—all of which contributes to OEE.
Keeping Up with Kilogram per Hour per Man Hour
What’s most important to the kilogram per hour per man hour metrics is its ability to help you determine resource allocation. After all, your operations want to provide the desired output in the fastest and most productive way. The kilogram per hour per man hour metric helps you pivot to be maximally effective. As a bonus, you see the actual cost of a product, including raw and pack material plus labor.
Improve KPIs to Enhance OEE
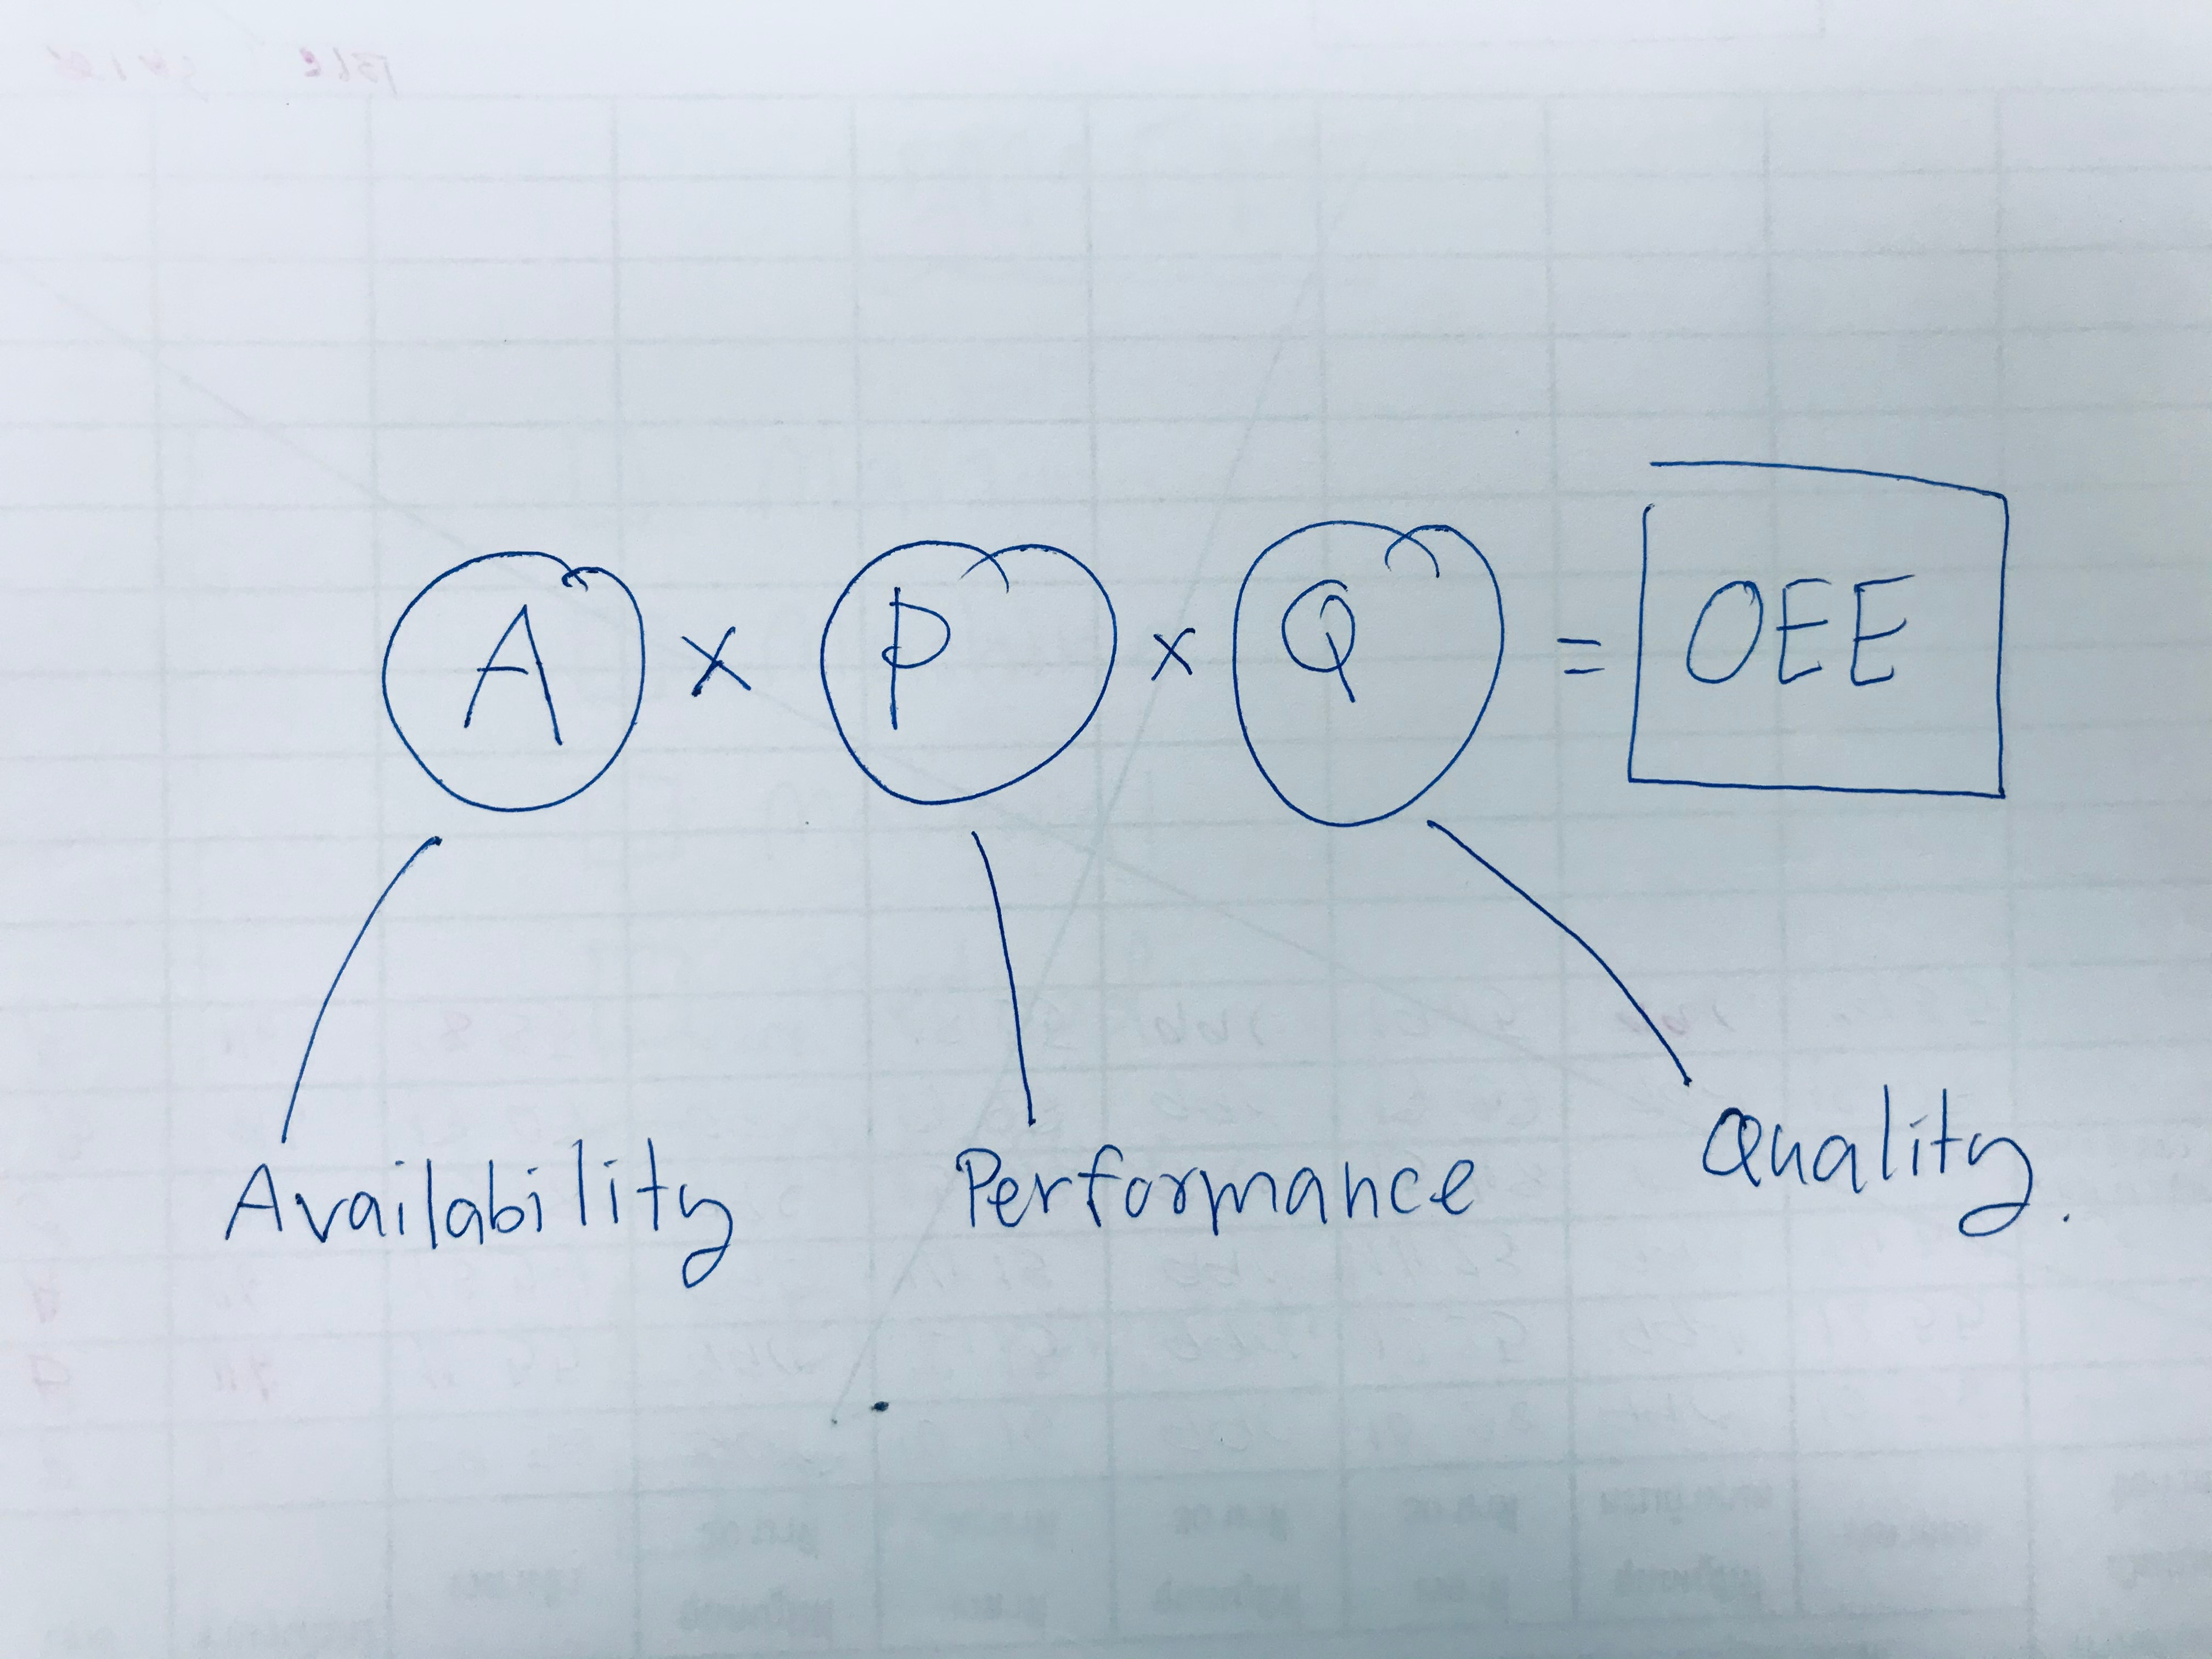
Overall equipment effectiveness is a manufacturing metric that shows how much of a factory’s manufacturing time is actually productive compared to its full potential. As the name implies, the measure hones in on factory equipment, and managers can assess OEE scores (expressed as a percent) by line, shift, and more. OEE is a measure of three aspects: availability, performance, and quality.
Availability
Availability is an equipment's actual run time compared to its planned run time, expressed as run time / planned production time. That said, if there is equipment downtime, its availability percentage goes down—along with overall OEE value.
Performance
Performance is all about equipment speed—including operating speed (plus interrupted cycles) and micro-stops along the way. Here, operating speed is measured based on production counts. Performance is expressed as (ideal cycle time x total count) / run time. The result compares the fastest possible production time with actual production time.
Quality
Quality compares the number of good parts produced with total parts produced. Good parts pass inspection the first time around without rework. Total parts produced include good parts, parts that need rework, and rejected parts. Quality is expressed as good parts count / total parts count. In practice, OEE = availability x efficiency x quality.
Improving OEE with Worximity’s Tile Suite
To improve OEE results, factories need to get KPIs such as throughput, yield, and downtime on an uptrend toward greater efficiency, productivity, and performance. That means meeting delivery schedules, reducing waste, and lowering costs. With Worximity's Smart Factory analytics, managers have easy access to real-time operational data, enabling teams to make on-the-spot changes to fix issues and meet targets.
Our Tileconnect sensors attach to your equipment to collect real-time performance data during production. The data goes to the cloud, where Smart Factory analytics takes over to assess OEE, distilling it into actionable insights—accessible via our Tile+ platform. Using Tile+, managers and team members alike can see trending data and production problems via custom dashboards, making it easy to immediately take corrective action.
Maximize Your Factory’s Potential
It’s essential to measure each core KPI in the food industry, from throughput and yield to unplanned downtime. Doing so reveals systemwide bottlenecks and recurring trends, which you can correct to reduce waste and cost. Technology can help you achieve maximum efficiency. By incorporating Smart Factory analytics into your operations, your team can become more nimble and address issues as they arise.
Download our Smart Factory analytics E-book, and get in touch with a Worximity expert to learn more.